Playgrounds for Health
Equity: A Mixed Methods Study in Urban Central Texas
Case Garza1, 2, Eugen Resendiz3, 4, Sara Le1,
2, Christian Corral1, Hue Mai1, Collette Steed1,
Ashley Messineo1, Ethan T. Hunt5, 6, and Deborah Salvo1,
2
1People, Health, and Place
Lab, Department of Kinesiology and Health Education, College of Education, The
University of Texas at Austin, U.S.A.
2Center for Research to
Community Impact (CRCI), College of Education, The University of Texas at
Austin, U.S.A.
3School of Architecture,
Art and Design, Tecnologico de Monterrey, Mexico City, Mexico
4Center for the Future of
Cities, Tecnologico de Monterrey, Mexico City, Mexico
5Michael and Susan Dell
Center for Healthy Living, University of Texas Health Science Center at Houston
(UTHealth Houston) School of Public Health in Austin, U.S.A.
6Department of Health
Promotion and Behavior Science, University of Texas Health Science Center at
Houston (UTHealth Houston) School of Public Health, U.S.A.
Abstract
Active outdoor
play is a critical source of physical activity for children, and playgrounds constitute
a key setting. However, research examining equity in access to playgrounds through
a public health lens is limited in the United States (U.S.). This study in Austin,
Texas, aimed to (1) assess geographic equity in public playground availability and
(2) understand the organizational landscape and key actors' perspectives on
barriers and opportunities for improvement. All metropolitan area public-access
playgrounds were geocoded, and census tracts were categorized by playground
count, median household income, percent of the population under ten and
predominant race/ethnicity. Multinomial regression models examined the associations
between neighborhood sociodemographic characteristics and playground
availability. An organizational landscape analysis identified key organizations
of relevance for playground access equity. Semi-structured interviews were
conducted with representatives of key organizations, and inductive coding was
used to identify themes. Results indicated greater availability of playgrounds
in higher-income and predominantly non-white neighborhoods independent of the
number of children a neighborhood had. Thirty-five key organizations across
four partially overlapping focus domains (government,
construction/architecture, community engagement, advocacy) were identified. Key
informant interviews revealed six main themes (equity, community-based work,
community mobility, playground environment, organizational scope, and advancing
playground initiatives). Policy efforts in Austin should address socioeconomic
disparities in playground availability and strengthen cross-sectoral
collaboration.
Keywords: Physical Activity, Active Play, Active
Living, Playgrounds, Health Equity, Urban Health
A physically active lifestyle in early life is
associated with healthy development and an active adulthood (Corder et al., 2019). Active children benefit from
improved motor skills, cognitive development, the potential for improved
academic achievement, and positive classroom behaviors (Zeng et al., 2017; Álvarez-Bueno
et al., 2017). In the United
States (U.S.), approximately 80% of children and youth aged 6-17 do not meet
the physical activity guidelines according to the 2023 National Survey of
Children's Health. Racial/ ethnic disparities have also been documented, with
higher inactivity rates among Black (78.3%), Hispanic (83.7%), and Asian
(87.2%) children compared to non-Hispanic white children (77.2%) (Child and Adolescent Health Measurement
Initiative & U.S. Department of Health and Human Services, Health Resources
and Services Administration (HRSA), Maternal and Child Health Bureau (MCHB),
2023).
Active play is a primary source of
physical activity for children, and the
outdoors is a key location for this health behavior, with public playgrounds
being a key setting (Brockman et al., 2010; Tremblay
et al., 2015; Gustat, 2023). Built and social environment characteristics of
neighborhoods are known determinants of active play among children, and
research has shown that disparities in access, size, and conditions of
playgrounds can lead to lower use in areas with higher poverty rates (Huang et al., 2020; Cohen et al., 2016). Despite this, there are limited studies
comprehensively assessing playground access equity in U.S. cities through a
public health lens, where most active play, recreation, and sport research has
focused on school and childcare settings (Schipperijn
et al., 2024).
Modifying the built environment to promote health
(e.g., new playground placement decisions, physical or transportation access
improvements to existing playgrounds) requires working with sectors and actors
beyond health (e.g., urban and transportation planning, parks and recreation,
non-governmental organizations) (Litt et
al., 2013). As such, it is critical to
identify and engage the individuals and organizations with purview or influence
on playground funding, placement, design, and improvements. To our knowledge,
to date, there is no known published peer-reviewed study documenting the
organizational landscape of equity in playground availability in U.S. urban
contexts.
Likewise, given the important role of
playgrounds for facilitating access to active play opportunities for all
children, and in particular, for minoritized and economically disadvantaged
families, developing and testing strategies to improve playground access equity
in underserved communities is a critical need (Floyd et al., 2009). To achieve this, an important first step is to develop and test
methods and protocols to assess the geographic availability of playgrounds.
This paper reports on two interrelated
sub-studies that aim to fill the aforementioned research gaps. The two sub-studies
are part of a comprehensive, formative research assessment study of playground
availability and utilization in Central Texas. The study aimed to: (1)
Objectively assess geographic public playground availability equity in Austin,
Texas, USA (sub-study 1) and (2) Understand the organizational
landscape related to playgrounds and the perspectives of the key actors on
barriers and opportunities to improve geographic playground availability in
Austin, Texas, USA (sub-study 2).
Methods
Setting and
Study Design
This
study included an ecological analysis of the association of neighborhood-based
sociodemographic characteristics with neighborhood-levels of playground
availability and a mixed-methods organizational landscape analysis. The study
took place in the Austin Metropolitan Area, where approximately half of the
population is non-White (i.e., belongs to a minoritized community group) (United States Census Bureau, 2022a).
In recent years, housing costs have rapidly risen due to gentrification in an
area known as the “Eastern Crescent” (a historically segregated part of the
city due to practices such as redlining), which has led to widening income
inequalities and growing cases of displacement among communities of color (Way
et al., 2018).
Data Collection
Procedures and Measures
This
study was approved by the Institutional Review Board (IRB) of The University of
Texas at Austin (approval number: STUDY00005688).
Sub-study 1:
Playground Geographic Access Equity Analysis
The geographic unit of analysis was
neighborhoods in the urbanized Austin Metropolitan Area, which we
operationalized as the Urban Area Census Tracts in the Austin–Round Rock–San
Marcos Metropolitan Core Based Statistical Area (MCBSA; also referred to as the
Austin–Round Rock–Georgetown Metropolitan Core Based Statistical Area) as set
by the United States Census Bureau (2019, 2020, 2023). Three separate
U.S. Census Bureau datasets, all obtained from the Bureau’s TIGER/Line
Shapefiles web interface portal, were used to determine our study's geographic
unit of analysis (United
States Census Bureau, 2019, 2019, 2020).
MCBSAs are counties in the country with an
urban area of at least 50,000 residents, and the adjacent counties that have a
high degree of social and economic integration with the core (United States
Census Bureau, 2022c). The second dataset delineated areas of the MCBSA that
were urban (vs. rural) to ensure only spaces in the MCBSA with a substantial
population were being evaluated. Urban areas were densely developed, comprising
residential, commercial, and other nonresidential land use types, and they also
consisted of a high population density, showing the “urban footprint” (United
States Census Bureau, 2022c). Lastly, census tracts, or small areas of the
country consisting of between 1,200 and 8,000 residents (with an optimum size
of 4,000), were used to operationalize neighborhoods. These areas are the
smallest unit available for geospatial analyses when using American Community
Survey data and are mostly permanent and standard in size (United States Census
Bureau, 2022c).
Measures:
Sub-study 1
Sociodemographic
Neighborhood Characteristics
The 2022 American Community Survey 5-Year
Estimates were used to derive neighborhood-level sociodemographic
characteristics, including race/ethnicity, median household income, percent of
the population that is under ten years old, and population density for the
Austin Metropolitan Area (United States Census Bureau, 2022a, 2022b).
The proportion of neighborhood residents who were
non-Hispanic white and those of all other races (non-white) operationalized the
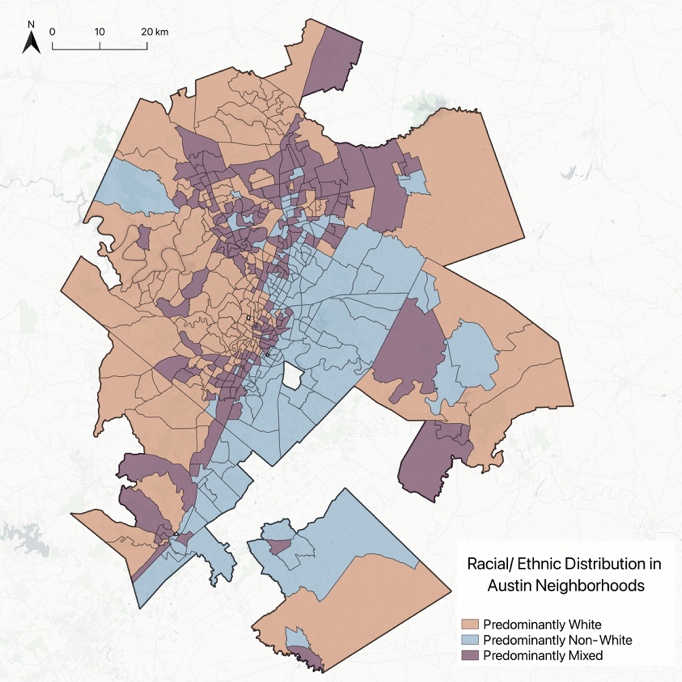
predominant racial and ethnic composition of each neighborhood. Neighborhoods
were then categorized based on these proportions as: 0) predominantly white (≥
60% white), 1) predominantly non-white (≥ 60% non-white), or 2) predominantly
mixed race (neither group ≥ 60% of the population share). Neighborhoods were
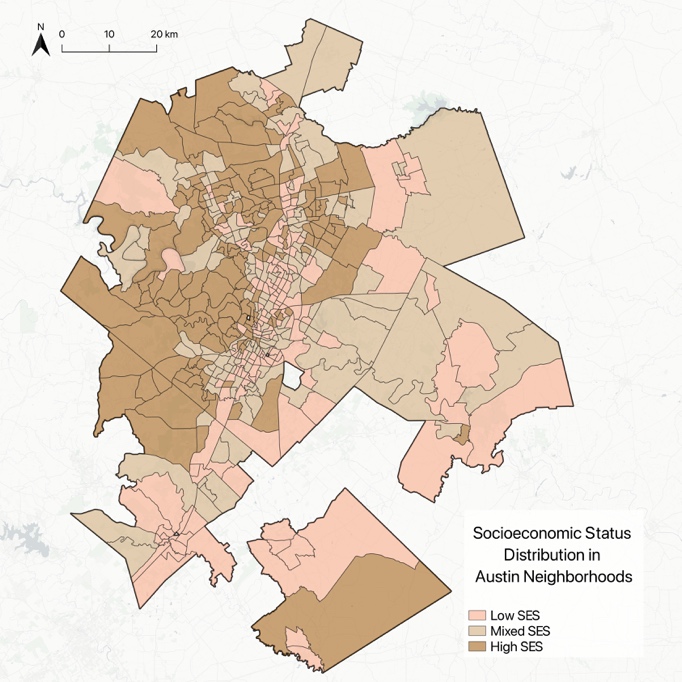
categorized into tertiles based on their median household income as: 0) low:
< $79959, 1) mixed: ≥ $79959 & < $110368, and 2) high: ≥ $110368. Percentage
of the total neighborhood population corresponding to children under 10 years
old was calculated and then neighborhoods were categorized as being average or below
(≤11.3%) and above average (>11.3%) with respect to proportion of the
population who are young children. Total population and population density (total
people per sq. kilometer of land area) were also calculated for each
neighborhood.
Geographic
Playground Access
Publicly available GIS data on point-based
playground locations were downloaded from the City of Austin Parks and
Recreation (PARD) geospatial data hub, and OpenStreetMap (OSM) data were used
to complement these data. Playgrounds identified were verified to be open to
the public (i.e., not located in a locked and gated community, at a private
residence, belonging to a private business, or located at a school/church)
using Google Street View (City
of Austin Parks and Recreation, 2023). Joint-use
playgrounds were removed from the City of Austin dataset, as not all other
jurisdictions in our study universe provided data on their joint-use sites. Playground
structures near each other in the same park were consolidated into a single
point, as these were typically the same playground but with separate structures
for specific age groups. Exceptions were made when the two playgrounds were
separated by a substantial distance, such that, in a normal scenario, a child
could not move freely between the spaces. Lastly, a raw continuous variable of access to playgrounds was operationalized as the count of playgrounds per
census tract (representative of neighborhoods). A final categorical variable was
created for analysis, where census tracts were categorized as having no
playground availability (0 playgrounds), low playground availability (1
playground), or high playground availability (≥ 2
playgrounds). Analytic variables were
built using QGIS v3.40.5, and the final dataset was managed using RStudio v2024.12.1+563
(QGIS Association, 2025; R Core Team,
2025). A
detailed description of data sources and the GIS data downloading protocol can
be found in Supplemental 1.
Sub-study 2:
Organizational Landscape Analysis and Stakeholder Interviews
This mixed-methods study had two
complementary phases. First, an organizational landscape analysis to
systematically identify organizations, people, initiatives, and other key
actors involved in work related to playgrounds in the Austin Metropolitan Area.
This type of analysis is useful for understanding the work being done on a
specific issue in a given region. Landscape analysis can further inform
community-based participatory research and community-informed research by
identifying organizations with potentially limited visibility conducting
relevant work (Center for
Community Health and Development & University of Kansas, n.d.; Health In
Partnership, 2022). A sample
of stakeholders from each domain (as identified in the landscape analysis) was
recruited to complete semi-structured qualitative interviews.
The organizational landscape analysis
consisted of (a) defining key topics of focus with relevance to playground
equity, (b) developing a list of search terms, (c) conducting a systematic
search in Google, (d) abstracting key organizational data from the search
results, and (e) thematically coding the data to identify the key domains and
overlaps in the organizational landscape of playground equity in the Austin
Metropolitan Area.
Key topics related to playgrounds and
health equity were identified and converted into key search terms (ex., play
space, playground, coalition, NGO, etc.). Systematic Google searches were
conducted using Boolean operators and key search terms until saturation was
met. The Google Chrome browser extension Google Search Results Scraper v1.1 was
then used to extract the first 100 results in each search, including relevant
information about each result to be used for screening (Brain Gain Recruiting, LLC, 2025). Data were cleaned in Microsoft Excel by
removing duplicates and screened against inclusion and exclusion criteria. Results were included if they were: 1) located, operated,
or did business in the Austin Metropolitan Area; 2) mission, vision, values,
programming, and/or larger scope of work of the organization was related to
parks, playgrounds, and/or health equity as it related to parks/playgrounds.
Results were excluded if they were a neighborhood or a single park organization
representing an affluent area of Austin (high neighborhood SES and/or
predominant racial/ethnic composition was white, as this study focused on
minority communities), or a park not considered a city-wide (destination) park.
Message boards and community forums were excluded but could be used for
one-branch snowball sampling.
Contact information for included
organizations was collected using public-facing website data. Organizations
were then categorized into naturally emerging non-mutually exclusive domains.
One-branch snowball sampling identified additional organizations from those
previously included. Experts, including previously engaged partners, content
experts, researchers, and stakeholders, identified organizations that were not
included in the landscape analysis.
Using landscape analysis findings, purposive
sampling was used to recruit participants from four organizations, one from
each key domain. A 15-question semi-structured interview guide was developed to
cover five topic areas: a) organization and individual background, b)
organizational approach to equity, c) barriers to completing work, d) community
engagement, and e) collaboration efforts. Participants were offered a $50
virtual gift card as compensation for participating in a recorded Zoom meeting
that lasted up to 90 minutes. Verbal informed consent was obtained from all
participants prior to the interview beginning.
The Online Supplement provides additional
information on the methods and findings of the organizational landscape
analysis and key informant interviews, including the interview guide (see Supplemental
2, 3, and 4).
Analysis
Multinomial
logistic regressions were used to test the association between sociodemographic
characteristics (neighborhood racial/ethnic composition, median household
income tertile, and proportion of the population corresponding to children
under 10 years of age) and neighborhood playground availability in Sub-Study 1.
All models were adjusted for population density. Statistical analyses were
conducted in Stata 18 using a significance level of p<0.05 (StataCorp,
2024).
In Sub-Study 2, organizations identified
in the landscape analysis were categorized into non-mutually exclusive groups
of naturally emerging domains (qualitative inductive coding) based on the type
of organization they were and/or the work they conducted per their publicly
stated mission, vision, and/or objectives. Groups were collapsed until a final
set of domains could no longer be reduced. Key informant interview Zoom
meeting transcripts were reviewed and cleaned to ensure consistency with the
interview recording and to remove any identifying information. Two researchers
(CG and AM) independently coded the data using an inductive coding approach in
Microsoft Excel to identify themes and subthemes. Coders met to compare codes
and to reach consensus on a final set of themes and subthemes.
Results
Sub-study 1: Playground Geographic Access Equity Analysis
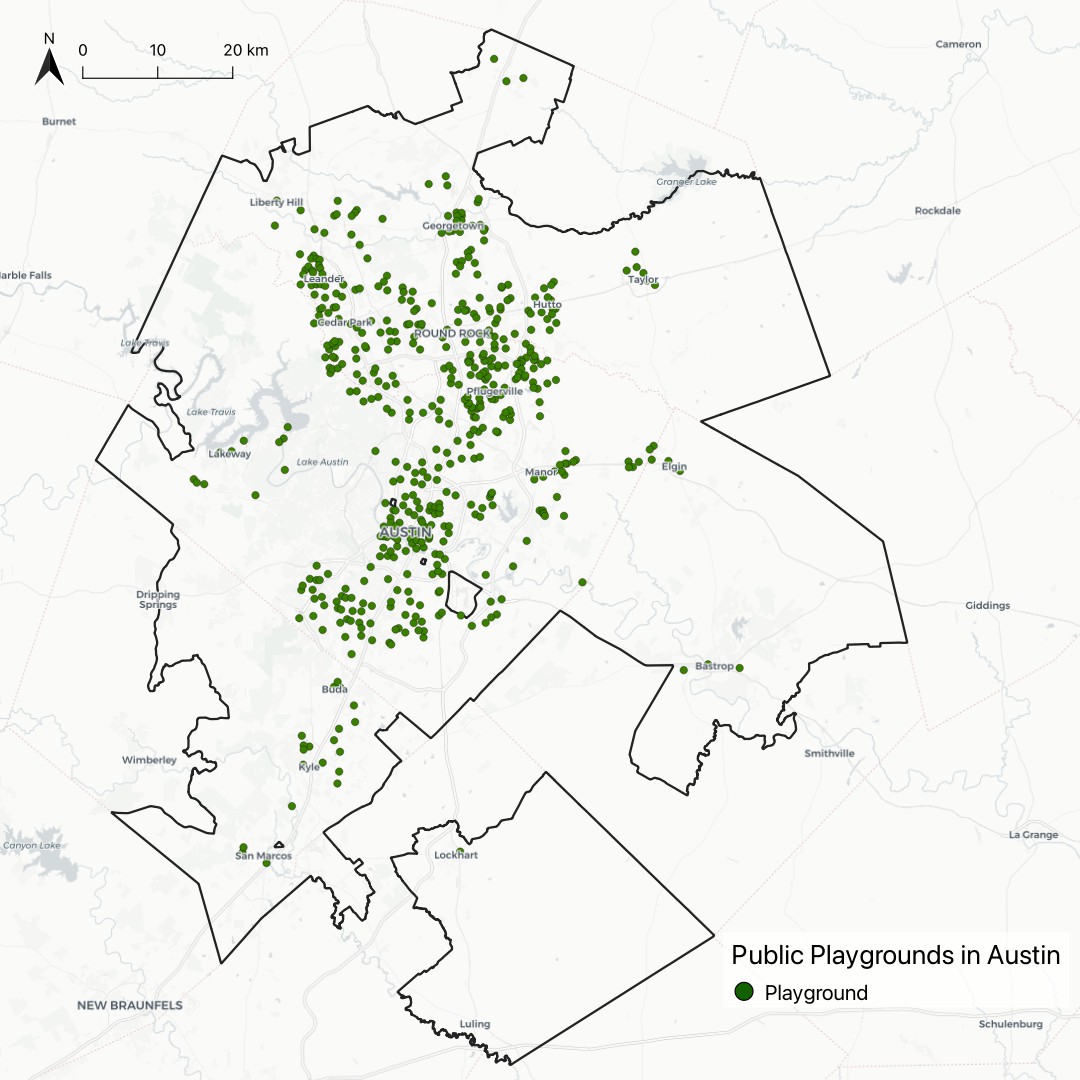
Four hundred seventy-two (N=472)
neighborhoods and 528 public playgrounds were identified in the Austin
Metropolitan Area (see Supplemental 5). Neighborhoods had an average of 1.1 playgrounds, with a range of 0
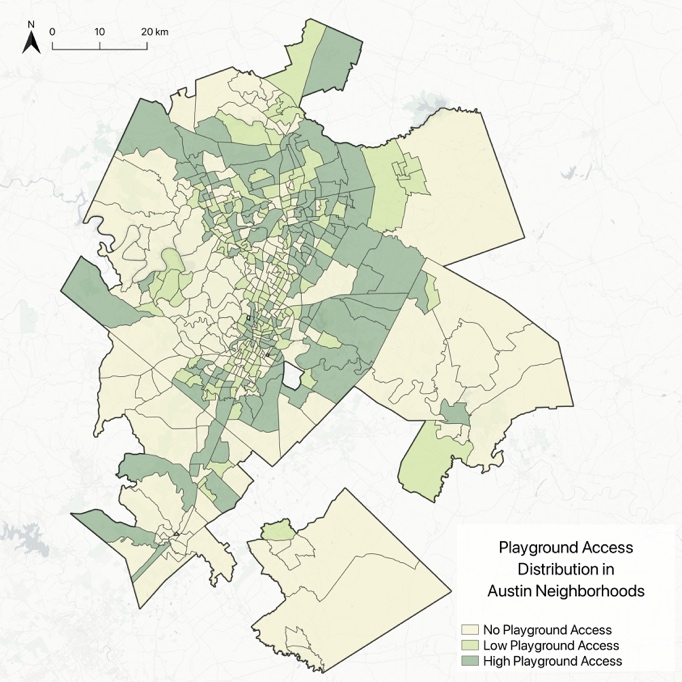
to 8. Zero available playgrounds were
found in 44.3% of neighborhoods, 27.3% had low
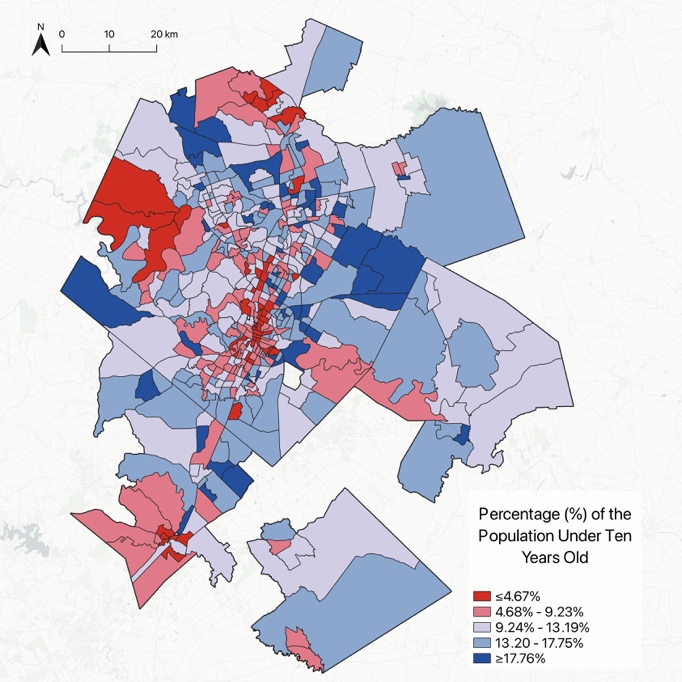
playground access, and 28.4% had high playground access (see Figure 1). Figure
1 also presents the geospatial distribution of median household income, the
racial/ethnic composition of Austin neighborhoods, and the percentage of the
neighborhood population who are children under 10 years.
Figure 1: Austin Metropolitan
Area Maps of Neighborhood Playground Access and Sociodemographic
Characteristics
|
|
|
|
A. Playground Access at the Neighborhood-Level in the
Austin Metropolitan Area, 2024
|
B. Socioeconomic Status Distribution at the
Neighborhood-Level in the Austin Metropolitan Area, 2022
|
|
|
|
|
C. Racial/ Ethnic Composition at the
Neighborhood-Level in the Austin Metropolitan Area, 2022
|
D. Percent of the total Populaiton that is under 10
years of age at the Neighborhood-Level in the Austin Metropolitan Area, 2022
|
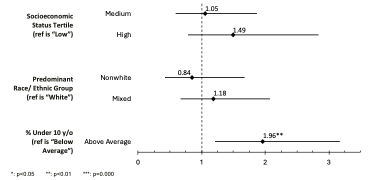
Findings
from the adjusted multinomial logistic regression model testing the
associations between neighborhood-level racial/ethnic composition,
socioeconomic status, and proportion of the population who are children under
10 are presented in Figure 2. As shown in panel A, neighborhood-level socioeconomic
status and racial/ ethnic composition had no significant association with the
presence of one playground (defined as “low playground access”) relative to
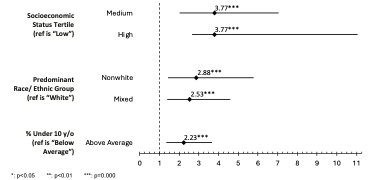
having zero playgrounds. However, when assessing high playground access (2 or
more playgrounds) vs. no access (0 playgrounds) (panel B), we found that
relative to low-income neighborhoods, both mixed-income (OR= 3.77, 95%CI: 2.02,
7.06, p=.000) and high-income (OR= 3.77, 95%CI: 2.65, 11.07, p=.000)
neighborhoods had significantly higher odds of having high playground access,
and both estimates had virtually equivalent magnitudes.
As expected, neighborhoods with an above
average proportion of the population corresponding to children under the age of
10 years had significantly higher playground presence than those at or below
the average, both in the comparison of low versus no playground access (OR=
1.96, 95%CI: 1.22, 3.18, p=.01), and in that of high versus no playground
access (OR= 2.23, 95%CI: 1.35, 3.66, p=.000). However, the inclusion of this
variable in the model, in addition to the adjustment for total population
density, did not eliminate the observed associations with neighborhood-level
socioeconomic status and race/ethnicity in our model.
Figure 2: Population Density Adjusted Associations of Neighborhood-Level
Sociodemographic Characteristics with the Odds of Low Playground Access and
High Playground Access (vs. No Access) in the Austin Metropolitan Area, 2024
|
|
|
A. Low Playground Access (1 playground) vs. No Access
|
|
|
|
B. High Playground Access (≥2 playgrounds) vs. No
Access
|
Sub-study 2:
Organizational Landscape Analysis and Stakeholder Interviews
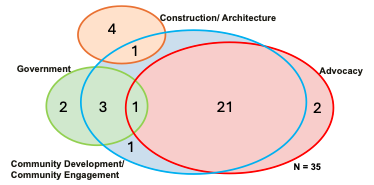
Organizational
Landscape Analysis
Thirty-five (N=35) organizations were
identified and categorized into four naturally emerging non-mutually exclusive domains:
a) Advocacy: Organizations broadly working to advance playground access
initiatives, mostly non-profit organizations, b) Community Development/
Community Engagement: Organizations that work directly in and with the
community to advance specific needs, c) Government: Organizations that operate
within the local, state, or federal government, and d) Construction/
Architecture: Organizations that design,
construct, or sell playground equipment and/or playground areas (see Figure 3).
Figure 3: Groupings of
Organizations into Naturally Emerging Non-Mutually Exclusive Domains
Stakeholder
Interviews
Four semi-structured, one-hour interviews
were conducted with representatives, one per domain identified in the landscape
analysis. The interviews lasted an average of 54 minutes.
Six themes (equity, work in and with the
community, community mobility, playground environment, scope of organizations’
work, and advancing playground initiatives) and 15 subthemes (marginalized
communities, addressing inequities, collaboration, community engagement,
cultural competency, access, transport, nature play, design/ construction,
improvement/ maintenance, organization goals, current work, limitations/
barriers to work, funding, and system level approaches) were identified (see
Supplemental 4 for theme and subtheme definitions and 3 for
extended example quotes).
Equity as an
Organizational Objective
Equity emerged as a key organizational
goal across all interviews, with several interviewees referring to Austin’s
Eastern Crescent, described by a government employee as an area which “circles
north to south and makes a big, long loop towards the East… where the majority
of people of color in Austin live.” This region of the city was also the
site of efforts “to address the inequities that we see in our park system” with
the City “working fairly diligently over the last 5…10 years” to
renovate parks and playgrounds in these historically underserved areas of
Austin.
Community
Mobility
Participants further discussed the way
inequities materialize beyond geographic access to play spaces with a community
organizer sharing how “People were experiencing outdoor spaces, differently
based on where they lived, based on their income, based on their race, their
ethnicity. Based on, you know all of these things played into their access to
outdoor spaces and their overall general health, both physical and mental
health” with this access playing into broader health disparities such as
lower levels of physical activity, increased levels of obesity and diabetes among
residents seen across the city (Austin Public Health, 2025).
Another key concern which underlines the
mobility inequities experienced by city dwellers in disadvantaged areas of
Austin, according to the organizational leaders interviewed, was safe mobility.
Meaning, that beyond the issue of proximity for community residents to access
playgrounds, the way in which these can be reached by foot is often not optimal
or ideal. For example, the representative of a local advocacy organization shared
how they recently learned, upon engaging community members about the impact of
a recent park renovation, the residents “were
walking on dirt paths” to reach the
park, so they added accessible trails and lighting to the renovation ensuring
it was “safe to get in there, and that people would use the space.”
Work in and
with the Community
Interviewees discussed the importance of cross-sector
collaboration as a strength of the work being done in Austin, especially
between the Parks and Recreation department and area Advocacy organizations, where
they “partner… on everything,” with the city helping “[guide] the
community engagement process” and taking on long term maintenance
responsibility after the organization “make[s] the improvement… [and]
gift[s] it to the City of Austin.”
Participants also discussed differences in
the community engagement process with a representative from a construction
company sharing of a nine-week co-design project they were part of working “two
days a week with designers… to find out specifically of teens and tweens,
[what] they would desire on a playground.” While a community organizer
highlighted challenges they have seen in government led community engagement
where “an inability [to] understand the experiences of [the] community” making
it “hard to get [to the community’s] needs.”
Advancing
Playground Initiatives
Funding was described as a major area of
concern for organizations, especially for the Parks and Recreation Department, which
has been impacted by state-level policy changes that have “gutted”
parkland dedication fees; a “funding stream… [which we had] really relied on
in the past.” These funding cuts led to the department needing to “get
creative with partnerships,” particularly with non-governmental organizations
having a similar mission and values.
The advocacy organization representative shared
how they filled this gap by becoming a close partner with the City and becoming
more intrinsically engaged in supporting the design, engagement, and permitting
of priority projects designated as being those responding to the “greatest
need” so they “can fill that funding gap that the city doesn't have the
ability to use their funds for” due to regulatory constraints. This
collaboration is seen as crucial to help the city achieve its goal of all
residents having “quality park access within a quarter mile or 10 min
walk of your home” with an emphasis on ensuring this in the eastern
crescent.
Playground
Environment
The playground environment was described by
interviewees as a site shaped by environmental constraints, the design process and
its regulations, and ongoing maintenance requirements. Nature-based playgrounds
were seen as a promising strategy to advance sustainability initiatives by
reducing the need to “transport playground equipment across the country” while
“increase[ing] connection to nature, which is hugely decreased as our city
continues to grow.”
The design and construction process stages were
identified as critical windows of opportunity which should be intentionally
child-focused by “consulting with children” and including them as key informants
and for “testing equipment.” Meanwhile, maintenance and improvement work were
seen as stages with key opportunities for the community to take ownership of
their local playground through initiatives like citywide cleanup days seen as a
“tangible way that [community members] can make an improvement.”
Scope of
Organizations’ Work
All interviewees described their missions
as being well aligned with the issue of playground access equity, but for some,
this type of focus is recent and is an extension to other core mission
activities. Such was the case of the community organization, whose
representative reported as having only recently taken up work on “green
space equity” after historically focusing on other social determinants of
health such as healthcare access, wages, immigration, and housing. Further, the
advocacy organization representative interviewed saw their work as supporting
parks through programing-based activations, volunteerism, park adoption, and
advocacy for park funding given that the “Parks department cannot advocate
for themselves with city council.”
All interviewees shared a number of
limitations that restrict the reach and ultimate impact of their work in
advancing playground access equity, with key issues that cut across all
interviews being funding, regulatory, and environmental constraints. For
example, the construction company representative discussed the issue of “toxins
in the ground,” which introduce additional construction costs and extended
timelines for project completion, or even the way “racism is a barrier” due
to Austin’s historically divided geography leaving parts of Austin with
historical under investment and pricing people out of their homes (McGlinchy,
2023).
Discussion
This mixed-methods study of playground
access equity in Austin included: (a) a geographic access to playgrounds
analysis, and (b) the identification and engagement of key actors in the
playground landscape with a qualitative analysis of key issues reported as
impacting playground access equity. Key findings included geospatial evidence
of socioeconomic-based inequities in geographic access to playgrounds, coupled
with higher availability of playgrounds in non-predominantly white
neighborhoods. Our organizational landscape analysis revealed insufficient
cross-sectoral collaboration among key agencies with purview or interest in
improving playground access equity in Austin, while revealing consistent
perceived barriers for advancing playground access equity across organizational
sectors, as well as a general consensus on their commitment to playground
equity as an organizational mission priority.
The socioeconomic-based inequities in
geographic access to playgrounds revealed by our findings show that even in
predominantly non-white neighborhoods, higher-income areas had better
geographic access to playgrounds than areas of lower income. Interestingly,
when examining the association of racial/ethnic neighborhood composition with
playground access, unexpected results revealed that non-predominantly white
areas had significantly higher access to playgrounds than predominantly white
neighborhoods. Importantly, these are findings from a single statistical model,
which thus mutually adjusts for the effects of both independent variables
(neighborhood socioeconomic status, and neighborhood racial/ethnic composition).
These findings may reflect an active investment by the City of Austin in
improving racial equity and access to community assets, like playgrounds, that
improve well-being and quality of life for residents. Indeed, Austin’s work to
address inequities in park access was highlighted by the qualitative interview
data of our study, with all organization representatives signaling to the
Eastern Crescent of Austin, an area with historical disinvestments, as a priority
setting for park and playground additions and improvements. Other
municipalities across the U.S. have prioritized addressing racial/ethnic
inequities relating to access to critical community assets through policy and
practice initiatives. As part of San Diego’s ‘Parks Master Plan’ the city is
working to “prioritizes equitable investments in parks in areas with the
greatest needs” by prioritizing regions of the city identified though an equity
metric to receive additional funds (City of San Diego, 2021). Cities such as
Louisville, Kentucky, have started to examine their spending practices and
evaluate all city parks, making the least-invested communities a priority for
future improvements to rectify historic prejudice and inequality in park
spending (The Trust for Public
Land, 2021). Other cities,
such as Milwaukee, Wisconsin, have worked to renovate playfields in high-need
areas through a comprehensive plan that accounts for neighborhood factors such
as race, income, poverty, and crime, while also looking at current park
conditions and access to ensure their more than 50 playfields are usable by all
communities (The Trust for
Public Land, 2021). Community
engagement has also been show to provide substantial impact in the sense of
ownership a community feels towards their local public parks, and the US
community guide recommends community engagement following the creation or
renovation of a public open space including parks to increase physical activity
among residents (Mullenbach et al., 2019; Guide to Community Preventive
Services., 2021). However, given the cross-sectional nature of this ecological
analysis, this finding may also reflect lower demand for public open spaces for
childhood recreation in higher-income areas, where families tend to have and
often prefer access to private recreation centers, sports clubs, or
after-school programming (Suminski
et al., 2011). Importantly,
while the relative volume of children in a neighborhood was associated with the
playground availability, the inclusion of this variable in the model did not
eliminate or even attenuate the significant associations between neighborhood
socioeconomic status and racial/ ethnic composition, suggesting that demand is
not the sole, nor the predominant driver of neighborhood playground
availability in Austin.
Results from our organizational landscape
analysis showed that most organizations conduct work related to community
development and engagement, followed closely by advocacy, with a few also
working in construction, architecture, and the government sectors. During
interviews with key stakeholders, the theme of collaboration emerged through
formal and informal channels. Some organizations have longstanding partnerships
that were crucial to helping each other complete their work, while others
mentioned a need to increase opportunities for collaboration to achieve play
space equity for all children in Austin. Our
findings underscore that while cross-sectoral collaboration is widely
recognized as essential to advancing playground access equity in Austin, its
effectiveness hinges on the meaningful inclusion of grassroots community
organizers who may not be seen as central to the issue at hand though they are
most connected to communities and have the ability to increase usage and
revitalization of these spaces though meaningful community engagement (Jacob et al., 2024).
As highlighted in Figure 3, no construction/architecture organization working
in the playground space has any type of overlap in their work and mission with
advocacy. Cross-sectoral collaboration is an area for future research and
practice. Ideally, all organizations with a vested interest in improving access
to playgrounds should work more closely and explicitly involve the communities
they intend to serve, as co-creation can help develop a sense of ownership and
belonging, which can foster greater use, particularly among historically
underserved and minoritized groups (“Co-Production
in Community Development,” 2018; Mainka et al., 2016; Meetiyagoda et al., 2024).
This mixed methods study provided valuable
insights on some of the common challenges cities like Austin face for promoting
playground access equity. Throughout the qualitative study participants
discussed the importance of collaboration with other sectors to navigate
complex funding and policy landscapes and to ensure that projects are not just
being built but truly accessible for the city. Participants also shared the
need and successes seen when the communities voice is centered throughout the
process of constructing a new or renovating a playground. This type of
collaborative effort to engage the community and other sectors outside of the
traditional parks and recreation space has shown success in some cities in the United
States. In Atlanta, Georgia the cities “Atlanta Beltline” project brings
together other non-traditional sectors to the renovation of old rail line
corridors. Through collaborations with public works, transportation, and
housing the city has transformed a 22-mile loop into a vibrant park and transit
space that connects 45 neighborhoods across the city as well as provide housing
close enough that allows all residents to access the space (Atlanta Beltline,
n.d.). Additionally, all interviewed playground stakeholders consistently
reported a landscape of suboptimal funding for playground access equity
promotion, coupled with high costs and a complicated to navigate regulatory
environment for playground construction and improvement projects. To address the
seemingly over-inflated cost of playground developments US cities like Austin can
learn from other parts of the world. For instance, in London the average cost
of a playground is $30/sf while in the US it is $48/sf. This difference in cost
is mainly driven by less rigid regulations, and the allowability of employing a
more diverse range of building materials and to design play structures
considered too risky for child play in the US. When contrasted with comparable
playgrounds in US cities, London playgrounds see 55% more total visitors,
16-18% more physical activity, and less child injuries (Studio Ludo, 2017). Finally,
the geospatial component of our work revealed that independent of racial/ethnic
neighborhood composition, neighborhood wealth appears continues to drive
playground availability, and hence, that while structural geographic racism is
not apparent in Austin with regards to playground availability, structural
geographic classism persists. A potential solution for cities like Austin
facing multiple overlapping forms of inequities in playground access is to
consider adopting an intersectionality approach to comprehensively and
synergistically tackle all forms of systemic biases that lead to health inequities
in communities (Williams et al., 2023). Intersectionality considers the joint
and interactive influence of multiple social identities (race, socioeconomic
status, gender, etc.) (Runyan, 2018). The importance of such an approach was
further emphasized by our qualitative interviews. The community organizing
representative interviewed emphasized the need to listen to the voices of all
key community members and organizing groups when designing and rolling out
equity-intended policies in historically disadvantaged communities, as a means
to fully address all forms of inequities and injustice operating in those
settings.
This study had several limitations. The GIS
analysis in sub-study 1 used data from secondary sources whose main purpose is
not research (e.g., the City of Austin data portal, OpenStreetMap data);
therefore, although we attempted to be comprehensive in geolocating all
public-access playgrounds in the Austin Metropolitan Area, some may have been
missed. Additionally, we operationalized access to playgrounds by considering
the number of available playgrounds in each neighborhood. This means that our
variable measures the existence of playgrounds rather than how easily residents
can reach and use these amenities. This method of assessing access has
previously been shown to contribute to the modifiable areal unit problem (MAUP)
(Wang et al., 2021). MAUP is a statistical bias that occurs
when analyzing spatial data aggregated into areal units of varying sizes, such
as census tracts (Wong, 2004). This potential bias in our analysis could
lead to differing results if a different spatial scale were to have been used (i.e.,
census block group or zip code). In sub-study 2, interviewed informants were
not randomly selected, but rather, were conveniently selected by harnessing our
existing network.
Despite its limitations, our study also had
many strengths. To our knowledge, this is the first study of its kind
conducting a comprehensive assessment of the status and potential drivers of
equitable access and use of playgrounds in a U.S. city. We utilized community
partner-informed and engaged mixed-methods, including various
state-of-the-science, complementary approaches. Importantly, our design and
methods allowed us to bring context to our quantitative findings by engaging
with community partners, such as the local parks and recreation department and
other nonprofits engaged in advocacy work.
Future work examining equity in geographic
access to public playgrounds should aim to conduct a larger, more
representative study using the methods employed in this study. Researchers
should also continue to engage with community stakeholders, especially local Parks
and Recreation Departments, when conducting studies of this type to ensure that
they not only advance the scientific field but also inform and provide benefits
to the government's work.
Our findings offer insights for researchers
and policymakers aiming to promote playground equity in urban areas of the U.S.
Improving access, increasing the use of playgrounds, and fostering community
ownership require regular programming, clear communication, and consistent
maintenance, all of which can be enhanced through cross-sectoral collaboration,
community engagement, and the use of evidence to drive decisions (e.g., for new
placements, access enhancements, or programming). Therefore, researchers should
actively engage with key stakeholders (including the communities themselves)
when conducting similar studies. This approach not only advances scientific
knowledge but also informs and benefits governmental and non-governmental efforts,
aiming to achieve meaningful and equitable improvements in public play spaces,
particularly in communities that have historically been underserved.
Correspondence should be addressed to
Deborah Salvo
2109 San Jacinto Blvd.
Austin, TX 78712
dsalvo@austin.utexas.edu
(512) 471-8599
 Case Garza:
0009-0000-4668-5832
Case Garza:
0009-0000-4668-5832
Eugen
Resendiz: 0000-0002-4500-879X
Sara
Le: 0009-0001-4089-047X
Christian Corral : 0009-0000-5799-6417
Hue Mai: 0000-0001-5010-9723
Ashley Messineo: 0009-0009-9913-4837
Ethan T. Hunt: 0000-0002-7350-7369
Deborah Salvo: 0000-0002-9726-0882
Acknowledgments
We thank all participants for
their time and contributions to this study. We also thank Dr. Jasper
Schipperijn, director of the World Playground Research Institute at the
University of Southern Denmark, for his guidance in the development of this
pilot study. The work was funded by startup funds of the People, Health, and
Place Lab (Salvo PI) at The University of Texas at Austin.
Conflict of interest
statement:
We have no conflicts of
interest to disclose.
Author Contributions
Conceptualization, Funding
Acquisition, and Supervision D.S.; Methodology, C.G., E.R., D.S.; Investigation,
C.G., E.R., S.L., H.M., C.S., A.M., D.S.; Formal Analysis, C.G., E.R., S.L., C.C.,
D.S.; Writing – Original Draft, C.G., D.S.; Writing – Review & Editing, C.G.,
E.R., S.L., C.C., H.M., C.S., A.M., E.H., D.S.
Creative Commons License
This work is licensed under
a Creative Commons
Attribution-Noncommercial 4.0 International License (CC BY-NC 4.0).
References
Álvarez-Bueno, C., Pesce, C.,
Cavero-Redondo, I., Sánchez-López, M., Garrido-Miguel, M., &
Martínez-Vizcaíno, V. (2017). Academic Achievement and Physical Activity: A Meta-analysis. Pediatrics,
140(6), e20171498. https://doi.org/10.1542/peds.2017-1498
Atlanta Beltline. (n.d.). Atlanta
Beltline Progress, Planning, and Policies. Retrieved January 9, 2026, from
https://beltline.org/learn/progress-planning/
Austin Public Health. (2025). 2025 Austin/ Travis
County Community Health Assessment.
Brain Gain Recruiting, LLC. (2025). Google Search
Results Scraper (Version 1.1) [Computer software]. Brain Gain Recruiting,
LLC.
https://chromewebstore.google.com/detail/google-search-results-scr/cmdkhofenchpdlkbpkheddfgfdmmobcc?hl=en
Brockman, R., Jago, R., & Fox, K. R. (2010). The
contribution of active play to the physical activity of primary school
children. Preventive Medicine, 51(2), 144–147.
https://doi.org/10.1016/j.ypmed.2010.05.012
Center for Community Health and Development &
University of Kansas. (n.d.). Chapter 7., Section 8. Identifying and
Analyzing Stakeholders and Their Interests. The Community Toolbox.
Retrieved July 11, 2025, from
https://ctb.ku.edu/en/table-of-contents/participation/encouraging-involvement/identify-stakeholders/main
Child and Adolescent Health Measurement Initiative
& U.S. Department of Health and Human Services, Health Resources and
Services Administration (HRSA), Maternal and Child Health Bureau (MCHB).
(2023). 2023 National Survey of Children’s Health (NSCH) Data Query.
Data Resource Center for Child and Adolescent Health.
http://www.childhealthdata.org/
City of Austin Parks and Recreation. (n.d.). School
Parks. https://www.austintexas.gov/page/school-parks
City of Austin Parks and Recreation. (2023). Pard
facility points [Dataset]. Austin Parks and Recreation Geospatial HUB.
https://austin-parks-and-recreation-austin.hub.arcgis.com/maps/27aa5e7c4be74a439078b3fef086296c
City of San Diego. (2021). Parks Master Plan: Parks
for All of Us.
https://www.sandiego.gov/sites/default/files/parks-master-plan-adopted-2021.pdf
Cohen, D. A., Han, B., Nagel, C. J., Harnik, P.,
McKenzie, T. L., Evenson, K. R., Marsh, T., Williamson, S., Vaughan, C., &
Katta, S. (2016). The First National Study of Neighborhood Parks: Implications
for Physical Activity. American Journal of Preventive Medicine, 51(4),
419–426. https://doi.org/10.1016/j.amepre.2016.03.021
Co-Production in Community Development. (2018). In D.
Vanleene & B. Verschuere, Co-Production and Co-Creation (1st ed.,
pp. 198–207). Routledge. https://doi.org/10.4324/9781315204956-31
Corder, K., Winpenny, E., Love, R., Brown, H. E.,
White, M., & Sluijs, E. van. (2019). Change in physical activity from
adolescence to early adulthood: A systematic review and meta-analysis of
longitudinal cohort studies. British Journal of Sports Medicine, 53(8),
496–503. https://doi.org/10.1136/bjsports-2016-097330
Floyd, M. F., Taylor, W. C., & Whitt-Glover, M.
(2009). Measurement of Park and Recreation Environments That Support Physical
Activity in Low-Income Communities of Color: Highlights of Challenges and
Recommendations. American Journal of Preventive Medicine, 36(4,
Supplement), S156–S160. https://doi.org/10.1016/j.amepre.2009.01.009
Guide to Community Preventive Services. (2021, July). Physical
Activity: Park, Trail, Greenway multicomponent.
https://www.thecommunityguide.org/findings/physical-activity-park-trail-greenway-infrastructure-interventions-combined-additional-interventions.html
Gustat, J. (2023). Association of Playground
“Playability” With Physical Activity and Energy Expenditure. Preventing
Chronic Disease, 20. https://doi.org/10.5888/pcd20.220247
Health In Partnership. (2022). Activities to Deepen
Your Power-Building Analysis.
https://www.healthinpartnership.org/resources/activities-to-deepen-your-power-building-analysis
Huang, J.-H., Hipp, J. A., Marquet, O., Alberico, C.,
Fry, D., Mazak, E., Lovasi, G. S., Robinson, W. R., & Floyd, M. F. (2020).
Neighborhood characteristics associated with park use and park-based physical
activity among children in low-income diverse neighborhoods in New York City. Preventive
Medicine, 131, 105948. https://doi.org/10.1016/j.ypmed.2019.105948
Jacob, V., Reynolds, J. A., Chattopadhyay, S. K.,
Hopkins, D. P., Brown, D. R., Devlin, H. M., Barrett, A., Berrigan, D., Crespo,
C. J., Heath, G. W., Brownson, R. C., Cuellar, A. E., Clymer, J. M., &
Chriqui, J. F. (2024). Parks, Trails, and Greenways for Physical Activity: A
Community Guide Systematic Economic Review. American Journal of Preventive
Medicine, 66(6), 1089–1099.
https://doi.org/10.1016/j.amepre.2024.01.021
Litt, J. S., Reed, H. L., Tabak, R. G., Zieff, S. G.,
Eyler, A. A., Lyn, R., Goins, K. V., Gustat, J., & Tompkins, N. O. (2013).
Active Living Collaboratives in the United States: Understanding
Characteristics, Activities, and Achievement of Environmental and Policy
Change. Preventing Chronic Disease, 10, E19.
https://doi.org/10.5888/pcd10.120162
Mainka, A., Castelnovo, W., Miettinen, V.,
Bech-Petersen, S., Hartmann, S., & Stock, W. G. (2016). Open innovation in
smart cities: Civic participation and co-creation of public services. Proceedings
of the Association for Information Science and Technology, 53(1),
1–5. https://doi.org/10.1002/pra2.2016.14505301006
McGlinchy, A. (2023, June 22). Two
paragraphs forced Black residents to East Austin. Exploding real estate prices
forced them out. KUT Radio, Austin’s NPR Station.
https://www.kut.org/austin/2023-06-22/two-paragraphs-forced-black-residents-to-east-austin-exploding-real-estate-prices-forced-them-out
Meetiyagoda, L., Mahanama, P. K. S.,
Ley, A., & Amarawickrama, S. (2024). Relationship between sense of place and co-creation process:
A systematic literature review. Land Use Policy, 136, 106961.
https://doi.org/10.1016/j.landusepol.2023.106961
Mullenbach, L. E., Baker, B. L., Benfield, J.,
Hickerson, B., & Mowen, A. J. (2019). Assessing the relationship between
community engagement and perceived ownership of an urban park in Philadelphia. Journal
of Leisure Research, 50(3), 201–219.
https://doi.org/10.1080/00222216.2019.1581719
QGIS Association. (2025). QGIS Geographic
Information System (Version 3.40.5-Bratislava) [Computer software]. Open
Source Geospatial Foundation Project. http://qgis.org
R Core Team. (2025). R: A Language and Environment
for Statistical Computing (Version 2024.12.1+563) [Computer software]. R
Foundation for Statistical Computing. https://www.R-project.org/
Runyan, A. S. (2018). What Is Intersectionality and Why
Is It Important? Academe, 104(6), 10–14.
Schipperijn, J., Madsen, C. D., Toftager, M., Johansen,
D. N., Lousen, I., Amholt, T. T., & Pawlowski, C. S. (2024). The role of
playgrounds in promoting children’s health – a scoping review. International
Journal of Behavioral Nutrition and Physical Activity, 21(1), 72.
https://doi.org/10.1186/s12966-024-01618-2
StataCorp (Version 18). (2024). [Computer software]. StataCorp LLC.
Studio Ludo. (2017). London Study of Playgrounds: The
Influence of Design on Play Behavior in London vs New York, San Francisco, and
Los Angeles. https://www.studioludo.org/projects/london-study-of-playgrounds
Suminski, R. R., Ding, D., Lee, R., May, L., Tota, T.,
& Dinius, D. (2011). Youth Physical Activity Opportunities in Lower and
Higher Income Neighborhoods. Journal of Urban Health, 88(4),
599–615. https://doi.org/10.1007/s11524-011-9577-2
The Trust for Public Land. (2021). Parks and an
Equitable Recovery.
tpl.org/parks-and-an-equitable-recovery-parkscore-report
Tremblay, M. S., Gray, C., Babcock, S., Barnes, J.,
Bradstreet, C. C., Carr, D., Chabot, G., Choquette, L., Chorney, D., Collyer,
C., Herrington, S., Janson, K., Janssen, I., Larouche, R., Pickett, W., Power,
M., Sandseter, E. B. H., Simon, B., & Brussoni, M. (2015). Position
Statement on Active Outdoor Play. International Journal of Environmental
Research and Public Health, 12(6), Article 6.
https://doi.org/10.3390/ijerph120606475
United States Census Bureau. (2019). TIGER/Line
Shapefile, Core Based Statistical Areas, Metropolitan/Micropolitan Statistical
Area [Dataset]. United States Department of Commerce.
https://www.census.gov/cgi-bin/geo/shapefiles/index.php
United States Census Bureau. (2020). TIGER/Line
Shapefile, Urban Areas [Dataset]. United States Department of Commerce.
https://www.census.gov/cgi-bin/geo/shapefiles/index.php
United States Census Bureau. (2022a). Hispanic or
Latino Origin by Race [Dataset]. American Community Survey, ACS 5-Year
Estimates Detailed Tables, Table B03002.
https://data.census.gov/table/ACSDT5Y2022.B03002?g=050XX00US48021$1400000,48055$1400000,48209$1400000,48453$1400000,48491$1400000&moe=false&tp=true
United States Census Bureau. (2022b). Median
Household Income in the Past 12 Months (in 2022 Inflation-Adjusted Dollars)
[Dataset]. American Community Survey, ACS 5-Year Estimates Detailed Tables,
Table B19013.
https://data.census.gov/table/ACSDT5Y2022.B19013?g=050XX00US48021$1400000,48055$1400000,48209$1400000,48453$1400000,48491$1400000&moe=false&tp=true
United States Census Bureau. (2022c, April 11). Glossary.
Census.Gov.
https://www.census.gov/programs-surveys/geography/about/glossary.html
United States Census Bureau. (2023). TIGER/Line
Shapefiles, Census Tracts, Texas [Dataset]. United States Department of
Commerce. https://www.census.gov/cgi-bin/geo/shapefiles/index.php
Wang, S., Wang, M., & Liu, Y. (2021). Access to
urban parks: Comparing spatial accessibility measures using three GIS-based
approaches. Computers, Environment and Urban Systems, 90, 101713.
https://doi.org/10.1016/j.compenvurbsys.2021.101713
Way, H. K., Mueller, E., & Wegmann, J. (2018). Uprooted:
Residential Displacement in Austin’s Gentrifying Neighborhoods and What Can Be
Done About It. https://hdl.handle.net/2152/114835
Williams, P. C., Binet, A., Alhasan, D. M., Riley, N.
M., & Jackson, C. L. (2023). Urban Planning for Health Equity Must Employ
an Intersectionality Framework. Journal of the American Planning Association,
89(2), 167–174. https://doi.org/10.1080/01944363.2022.2079550
Wong, D. W. S. (2004). The Modifiable Areal Unit
Problem (MAUP). In D. G. Janelle, B. Warf, & K. Hansen (Eds.), WorldMinds:
Geographical Perspectives on 100 Problems: Commemorating the 100th Anniversary
of the Association of American Geographers 1904–2004 (pp. 571–575).
Springer Netherlands. https://doi.org/10.1007/978-1-4020-2352-1_93
Zeng, N., Ayyub, M., Sun, H., Wen, X., Xiang, P., &
Gao, Z. (2017). Effects of Physical Activity on Motor Skills and Cognitive
Development in Early Childhood: A Systematic Review. BioMed Research International,
2017(1), 2760716. https://doi.org/10.1155/2017/2760716
Supplemental Materials
Supplemental 1: Detailed Description of Data Sources and GIS Data
Downloading Protocol
Two sources were used
to identify public access playgrounds in the Austin Metropolitan Area. A
pre-filtered dataset from the City of Austin Parks and Recreation (PARD)
geospatial hub, which included only assets identified as “playground” or
“nature play space,” was downloaded (City of Austin Parks and Recreation,
2023). These data represent all PARD- managed playground and nature play spaces
in the City of Austin. The QGIS plugin “QuickOSM” was then used to import
OpenStreetMap (OSM) data for facilities with the key ‘leisure’ = ’playground’
within the geographic boundary of our study, identifying non-PARD playgrounds
and nature play spaces. School playgrounds, which served as joint-use sites
between Austin Parks and Recreation and the Austin Independent School District,
were identified and removed (City of Austin Parks and Recreation, n.d.). These
sites were removed to align with available data from other municipalities in
the Austin Metropolitan Area. Playgrounds identified using QuickOSM were verified
to be open to the public (i.e., not located in a locked and gated community, at
a private residence, belonging to a private business, or located at a school/
church) using Google Street View. Sites confirmed to be open to the public were
added to the PARD layer. Playground structures near each other in the same park
were consolidated into a single point, as these were typically the same
playground but with separate structures for specific age groups. Exceptions
were made when the two playgrounds were separated by a substantial distance,
such that, in a normal scenario, a child could not move freely between the
spaces; this decision was made jointly by two research assistants.
Supplemental 2: Key Informant Interview Guide
 Key Informant Interview
Guide
Key Informant Interview
Guide
Playgrounds for Health Equity
Give background on the study and how their
responses will be used.
-
Informed
Consent and Purpose: Have you received a copy of the research information document? We
will review this document to give you a chance to ask any questions you may
have. Your participation is voluntary, and it is totally up to you to decide
whether you want to participate. Even if you decide to be part of the study
now, you may change your mind and stop at any time. The purpose of the study is
to evaluate the potential impact of the equitable distribution and renovations
of playgrounds around the city on the health and well-being of its low-income
and minority residents. Through this study, we aim to add to the current (but
small) body of research literature evaluating the implications of social,
racial, and economic disparities on the presence and quality of community
playgrounds. Do you have any questions thus far? If you agree to participate in
this study, you will be asked to participate in a 90-minute recorded interview
with a number of questions about you and your organization's work. The
questions will cover five topic areas (organization and personal background,
organization approach to playground equity, barriers to completing work,
engagement with the community, and experience with cross-sectoral/ organization
collaboration). Do you have any questions thus far? Your privacy is important,
and our team will, to the best of our ability, take steps to keep identifiable
information about you confidential. Do you have any questions thus far? At the
conclusion of this interview, you will receive a $50 Tango e-gift card as compensation
for your time. Having heard this overview, do you have any questions about the
study, our procedures, or your participation in the study? Do you still wish to
proceed with your participation in the study?
-
Introduction: Because playgrounds have
been found to be excellent community assets that promote health, we are
interested in understanding the distribution of these spaces across the Austin,
Texas, Metropolitan area and determining if there are inequities in access across
racial/ethnic groups as well as income. Further, we are interested in
understanding the current scope of work being done by organizations in the area
as it relates to playgrounds.
-
When
we refer to playgrounds, we are referring to built structures for unstructured
play, as well as “nature play spaces,” which are typically composed of natural
resources that encourage more imaginative play. For the focus of this study, we
will ask you to only consider public play spaces, not private ones that one may
have access to but the general public does not.
Questions
Background:
-
What
is the mission and/or vision of your organization?
o PROBE: What are your
organization’s priorities and/or goals (short or long- term)?
-
What
is your current role in the organization? How long have you been in this role? Broadly
speaking, what are you responsible for in your role?
-
Who is
the target population that your organization works with/for?
-
How
does the topic of playground access intersect with the mission and work of your
organization?
o PROBE: access =
equity/social justice; parks, sports, recreation, physical activity; children
and families; outdoor spaces.
-
What
does your organization's current or planned work look like as it relates to
parks and playgrounds in the City of Austin?
Equity:
-
What
is your current perception of the public playground and park landscape in the
City of Austin and the broader metro area (number and quality of parks in an
area)?
o PROBE: What about the
distribution of resources? (monetary or other)
-
From
your perspective, in an ideal world, what does equitable distribution of
playgrounds and parks look like in the City of Austin?
o PROBE: What about the
equitable distribution of resources to support playgrounds and parks?
-
Has
your organization done any assessment or examination of areas of Austin that
may lack access to parks and playgrounds?
o If yes, what geographic
areas (zip code, neighborhood, broad region of the city) has your organization
identified as underserved as it relates to park and playground access?
-
In
public health and environmental justice research, the concept of playground
equity refers to every child having access to a quality space to engage in
unstructured play regardless of income and/or race/ethnicity. Does your
organization currently have any initiatives that address playground equity in
Austin, Texas?
Environmental Barriers:
-
In
your opinion, what are the most common barriers that limit a more equitable
distribution of parks and playgrounds in Austin?
o PROBE: An example in an
unrelated context would be if a school teacher were asked what barriers prevent
their children from completing their homework. They may say the child does not
have access to the internet at home or a school policy does not allow them to
take the necessary supplies home to complete the work.
-
In
your work thus far, have you identified any opportunities to address these
barriers both as part of the work of your organization and in collaboration
with other groups?
o PROBES: Collaboration can
be between departments of government, non- profits, advocacy groups, or funding
sources, among others. An example of an opportunity to address a barrier in an
unrelated context would be a school teacher who has noticed her students do not
have the necessary supplies to complete their homework and engaging with a
local non-profit to get access to necessary resources (pens, paper, hotspots,
etc.).
-
Are
there any policy changes that you believe need to be addressed to achieve
equitable public playground and park access for all children in Austin, Texas?
Community Engagement:
-
Does
your organization seek feedback and perspectives from the community members you
serve? If so, how?
o PROBE: Are there any
specific ways this relates to parks and playgrounds if your work focuses on
more than this domain?
o If yes... how do you use
the perspectives and needs expressed by community members? If so, how?
§ Is this an ongoing process
of collecting feedback as decisions are made or on a case-by-case basis?
-
In
your opinion, what resource do you have (if any) you can provide to the
community?
-
What
do the key features of a long-term collaboration partnership look like for your
organization, both in terms of what you expect in a partnership and what you
can offer?
Version: 2/27/2024
Supplemental 3: Example
Quotes per Subtheme from Key Stakeholder Interviews
|
Theme
|
Subtheme
|
Quote
|
|
Equity
|
Marginalized Communities
|
A government employee
mentioned the Eastern Crescent, interviewer
pressed for more
info: "The Eastern
Crescent of Austin is
basically the, it kind of circles north to south and makes a big, long loop towards
the East, and it is where the majority of people of color in
Austin live.”
|
|
Addressing
Inequities
|
Interviewer asked the government employee their current
perception of the public playground
landscape in the city: "We've actually been
working fairly diligently over the last 5…10 years to address the
inequities that we see in our park system, including playgrounds and so we have
done a number of
renovations that are specific to that Eastern Crescent [historically
marginalized area of Austin]."
|
|
Work in and with the Community
|
Collaboration
|
An advocacy organization employee discussing the work their
organizations work: “[W]e partner with the Parks [and Recreation]
Department on everything. [Every] project that we work on they're [part] of
our team as well and they [approve] everything that we do. They help us
[guide] the community engagement process and then, once we make the improvement or make
the improvement together, [we] gift it to the City of Austin, so they are
responsible for the maintenance and everything after we make the improvement.”
|
|
Community
Engagement
|
A playground construction company employee discussing
previous
work they had done: “We
went on to do co-design with [local organization
receiving a new playground], that was a nine-week project. I was there two
days a week with some designers, and we wanted to find out specifically of
teens and tweens, [what] they would desire on a playground.”
|
|
Cultural
Competency
|
A community organizer for a community engagement group
discussing the importance of understanding the community before
proposing changes that impact them: "But [probably] the thing that
we see the most is an inability [to] understand the experiences of [the] community [that
would], actually help understand what is needed by [the] community. I think,
if you don't understand [the] community, it's hard to get [to] its needs.”
|
|
Community
Mobility
|
Access
|
A community organizer
answering a question about how access to recreation space ties into their
community engagement work: “People were experiencing outdoor spaces, differently based on where
they lived, based
on their income, based on
their race, their ethnicity. Based on, you know all of these things played
into their access to outdoor spaces and their overall general health, both
physical and mental health. And so we see this [now] as something that
provides all of our member institutions, [an] opportunity to weigh in on what
a healthy community looks like, [and] what's in it?”
|
|
Transport
|
An advocacy organization employee discussing how the
community’s lack of access to a playground was identified
and addressed during a renovation: “But [we] also look at, how do people actually get there. [Are]
there bigger access problems within the park that we
can make improvements to? I think one that really comes to mind is [local
park name]. We renovated that one a few years ago… We just initially decided
to renovate the playground and take that, but we heard from the community
engagement that you know people were walking on dirt paths to get from a certain
access point… we did a lot of accessible trails and lighting to make sure
it's safe to get in there, and that people would use the space”
|
|
Playground
Environment
|
Nature Play
|
Interviewer asked
a government employee about nature play and how the city has used it to
address issues around floodplains and watershed restrictions: "But it's
[nature play spaces] been a
[way] for us to try something different to increase connection to nature,
which is hugely
decreased as our city
continues to grow, by using natural materials. It's also a way for us to meet
some sustainability goals because we're not having to transport playground
equipment across the country. So it's saving on carbon emission, it's using
natural materials instead of plastic and metal, so I think there's a lot of
co-benefits that come with putting in natural play spaces."
|
|
Design/
Construction
|
A playground construction employee
discussing engaging with the community during the playground design process: “So
we are based in consulting with children and making sure that children are
involved in the process of testing equipment… So there's feedback immediately from the start
always as a foundation of who we are as a brand, it's the right thing to do,
but it's also then how we communicate who we are in comparison to our
competitors.”
|
|
Improvement/ Maintenance
|
An advocacy organization discussing a volunteer day they host
biannually to support public park maintenance in Austin: “[I]t's a
tangible way that you can make an improvement. I think everybody feels good
when you can get together with your neighbors and do something in a park and
be out, especially when we have nice weather… We make sure that
every volunteer project
is approved, and they're [Parks and Recreation
Department] comfortable with it, and I know we work hand in hand to make sure
that that those [volunteer days]… are beneficial. [W]e have the stats on this
year's impact, 3,337 volunteers across 90 parks, they spread roughly
713 cubic yards
of mulch, which is a lot of mulch, and
that really helps
with the tree canopy,
they collected 34,000 pounds of trash… a $319,000 improvement towards parks…
I think that's a big impact.”
|
|
Scope of Organizations’ Work
|
Organization Goals
|
A community organizer sharing the issues
their organization works to
address: “[W]e do have an agenda of issues that we ask our lawmakers and
decision makers to endorse, and those are typically around healthcare, good
wages, housing, immigration, good
schooling, and now based on the work that we've been doing for the past few
years… green space equity.”
|
|
Current Work
|
An employes of an advocacy organization discussing the
work of the organization: “I think we just support people in green spaces.
[W]e do support a lot of activations… we know that creates healthy community to get
people together, in positive
ways… [W]e also encourage a lot of volunteerism… [W]e have a park adoption
program, so we have a lot of different things, and advocacy, we advocate for the Parks
[department] budget every
year… because the Parks department cannot advocate
for themselves with city council, but we can advocate the needs that we know,
so we have a pretty extensive effort to advocate for the budget every year
for funding.”
|
|
Limitations/
Barriers to work
|
A playground construction employee sharing barriers their organization
experiences when working with communities: “[E]cological environmental
barriers, your low-income communities, I'm thinking of one right now in
Atlanta, are not in the best environmental spaces. So, there may be toxins in
the ground that you didn't know about, ‘Oh, let's build a playground,’ well,
hang on a second, this is a brownfield that you know has toxic waste in it.
So now we have to, you know, do all these things to the ground… So, there's
that, and then that of course costs money… I think that there's been a lot of
good work and a lot of good movement in this area with advocacy. But you
know, if your tax base is low and you're thinking of spending a certain
amount of money, and parks are expensive especially ones that are outfitted
with playground equipment, and then you have all these extra environmental
barriers [and] then then the economic barrier also comes in… So those are
some barriers. You know, historically, there has been racism and
discrimination and horrible, horrible things in Austin. I've been on the parks
tour with City
Parks Alliance, and we had visited some of the parks and the names
not coming to mind.
But you know, telling the story and sharing that story of how people were separated, based on race
and had less resources, plain and simple. And we like to think that that
doesn't happen today, but it may just happen, because of well underlying
racism that people don't recognize as well as those geographical barriers
that are lined up with economic disparities in the community. So those are
barriers, racism is a barrier, selfishness is a barrier.”
|
|
Advancing Playground Initiatives
|
Funding
|
A government employee discussing recent changes to funding channels: “[A]
lot of our funding comes from how the State kind of allows things to happen…
a good example of this is when we went through changes to how Parkland
dedication fees could be allocated… the State kind of stepped in and said,
you know, developers are having to pay
too much money to contribute to Parkland, and so that, unfortunately, was
gutted, and so it's a funding stream that we have really relied on in the
past, because we don't have a huge
general fund allotment and it is a way that we have been able to develop out
parks throughout the city, and it's going to be a funding source that is no
longer available in any real sense. [I] think we're going to have to get
creative with partnerships… you know, teaming up with other agencies and
organizations that have the same values, that have the same mission, and that
can take on the burden of maintenance and operations which kind of frees up
the [department name] department to look at acquisition of properties.”
|
|
System Level Approaches
|
An advocacy organization employee
discussing their partnership with the Parks and Recreation Department to
overcome barriers to constructing new parks: “So we have, [park name],
that is in, [general geographic area of park in the city], but it's in an
area that has no parks, public parks around there, and so it was a high
priority. [W]e are providing the design, we did the visioning for the park
and the community engagement, then we paid for the consulting fees for the
engineers and landscape architects and the permitting fees, and then the
Parks Department had the full funding to construct that park. So, a lot of
times we can fill that funding gap that the city doesn't have the ability to
use their funds for, which I don't totally understand why they can't, I mean, there's
rules and laws,
and I guess that's what it is, but I think a lot of times…
our priorities are based on where the greatest need is. If there is a good
amount of money sitting there,
for a project that is worthy
by the Parks Department, but they have
some kind of barrier, whether
it's design and construction, we'll jump in and try and help
with that, because our funding will leverage the bigger dollars that
are already there.”
|
Supplemental 4: Definitions of Themes and Subthemes from Key
Stakeholder Interviews
|
Theme
|
Theme Definition
|
Subtheme
|
Subtheme Definition
|
|
Equity
|
Discussion
of (in)equities and/ or (in)equalities
affecting communities' playground access.
|
Marginalized
Communities
|
Participant talks about groups that historically have
or currently do not
have the same access to resources
as others.
|
|
Addressing
Inequities
|
Participant talks about how their
organization (or others) are working to combat inequities between communities.
|
|
Work in and with the Community
|
Discussion of how the organization conducts its work
in the community it serves.
|
Collaboration
|
Participant talks about working
in partnership with other sectors
and/or organizations.
|
|
Community
Engagement
|
Participant talks about how the
community is involved in the work of the organization.
|
|
Cultural
Competency
|
Participant talks about
understanding
the importance of knowing the culture
and practices of diverse
communities.
|
|
Community
Mobility
|
Discussion of the
community’s ability to safely use
and get to a playground.
|
Access
|
Participant talks about the
accessibility of playgrounds to the
community.
|
|
Transport
|
Participant talks about
transportation barriers in the community’s ability
to use public playgrounds.
|
|
Playground
Environment
|
Discussion of the
built playground environment.
|
Nature Play
|
Participant talks about the
implementation of nature
play
spaces.
|
|
Design/
Construction
|
Participant talks about the
design
and/or
construction process of public playgrounds.
|
|
Improvement/
Maintenance
|
Participant talks about
the
maintenance and improvement of existing playgrounds.
|
|
Scope of Organizations’ Work
|
Discussion of the organizations work related to playgrounds.
|
Organization Goals
|
Participant talks about
the goals of their organization and/or how they
hope to reach a goal.
|
|
Current
Work
|
Participant talks about
specific projects their organization is currently conducting.
|
|
Limitations / Barriers to work
|
Participant talks about
limitation or barriers that
make conducting their work challenging.
|
|
Advancing Playground Initiatives
|
Discussion of how
the organization works to advance their work.
|
Funding
|
Participant
talks about where funding comes from and the role of it in their organizations work.
|
|
System Level Approaches
|
Participant talks about policies and/or actions taken or could be taken to advance playground access.
|
Supplemental 5: Public Playgrounds Located in the Austin
Metropolitan Area, 2024