The
prevalence of physical and mental health issues has risen significantly in the
United States (US) in recent years compared to past decades (Twenge et al.,
2019).
Conditions such as poor mental health, poor physical health, and physical
inactivity are among the leading contributors to chronic diseases like obesity and
depression (Anderson &
Durstine, 2019; Booth et al., 2017; Harris, 2018, Kocjan et al.,
2024; Ohrnberger et al., 2017; National Heart, Lung, and Blood Institute, 2022). Currently, nearly
40% of US adults are classified as obese, 8.3% have major depression, and the
prevalence of physical inactivity is 25.3%, all risk factors that are linked to
severe and often fatal outcomes such as heart attacks and strokes (Centers for Disease
Control and Prevention [CDC], 2024; National Institute
of Mental Health, 2021; CDC, 2024e; Kurth et al.,
2002; Lavie et al., 2019; Pan et al., 2011; Penninx et al., 2001; Powell-Wiley
et al., 2021; Sher et al., 2010; Willey et al., 2017). Given the
prevalence of these concerns, there is an urgent need to tackle these issues
upstream and to consider the relation of neighborhood factors such as
walkability with diverse physical and mental health outcomes.
Indeed,
historically, much research has focused on individual-level risk factors,
whether behavioral or biological, often without considering the environments or
social contexts that facilitated their emergence and persistence (Diez-Roux, 2003). While this
approach has yielded valuable insights into personal determinants of health, it
overlooks the systemic and structural factors that shape individual behaviors
and health risks (Brown et al.,
2019; Link & Phelan, 1995). One of these structural level factors is neighborhood
infrastructure and accessibility to health-promoting environments (Tao et al., 2022). For instance,
living in neighborhoods with limited access to green spaces, poorly maintained
sidewalks, or high crime rates can constrain opportunities for physical
activity and increase stress levels, both of which are significant contributors
to physical and mental health problems (Foster
& Giles-Corti, 2008; Lauwers et al., 2021; Rees-Punia et al., 2018; Salvo
et al., 2018).
Such
narrow approaches fail to account for the diverse physical and social
characteristics of neighborhoods, which play a critical role in shaping
individual health outcomes relevant to such health outcomes (Diez-Roux, 2007,
2016; Diez-Roux et al., 2017).
Researchers
have recently begun to focus on assessing the effects of spatial context and
factors at the neighborhood level on residents’ health as an upstream solution (Diez-Roux, 2007;
Diez-Roux & Mair, 2010; Macintyre et al., 2002). This shift
underscores the importance of designing healthy communities, which is a crucial
step in mitigating physical and mental health problems (Kumar &
Preetha, 2012; Sallis et al., 2012). In particular, the walkability of
neighborhoods, as one key component of a built environment, can affect how well
individuals’ health outcomes are addressed at the population level (Kaczynski, 2010;
Laddu et al., 2021).
Neighborhood walkability can be defined as the extent to which the features of
the built environment allow residents to travel to work or walk for leisure,
exercise, and access to services (Kaczynski et al.,
2012; Leslie et al., 2007).
Walkability is often determined by factors such as mixed land use, street connectivity
(i.e., pedestrian-friendly grid-like street network), and net residential density
(i.e., population density), enabling people to engage in active transportation
on a daily basis safely (Wei et al., 2016; Lovasi et al.,
2011; Thomas et al., 2025).
Considering a neighborhood’s walkability is crucial because walkable spaces facilitate
low or no-cost physical activity, such as walking, jogging, or cycling, which
require minimal equipment or financial investment (McCormack et al.,
2022).
Also, engaging in physical activity regularly is associated with decreasing the
global burden of chronic diseases (Anderson &
Durstine, 2019).
Other research has also documented the favorable relationship between increased
walkability and important social and mental health factors, such as social
capital, social isolation, and depression (Asiamah et al.,
2023; Leyden, 2003; Mazumdar et al., 2018).
Given
its significant role in promoting diverse aspects of community well-being,
access to walkable environments may be considered a social determinant of
health (Westenhöfer et
al., 2023).
Unfortunately, some research suggests that walkable environments are not always
equitably available within and across communities (Bereitschaft,
2017; Pereira et al., 2023). For example, in the San Francisco Bay area, Riggs
found that black residents lived in less walkable neighborhoods (Riggs, 2016). Although such
research has shed light on disparities in walkable environments, a more
holistic means by which to address environmental justice issues is to consider the
construct of social vulnerability. Social vulnerability is defined as the
likelihood of a particular population being adversely affected by hazards, such
as those related to environmental or health issues (Andrew, 2015; Mah
et al., 2023).
It is comprised of several measures related to sociodemographic factors, population
density, and transportation, and may shape mobility patterns and active
transportation (Gordon-Larsen et
al., 2006; Hansmann et al., 2022; Riggs & Sethi, 2020). A number of
studies have examined the role of social vulnerability in this regard. For
instance, one study by Wali (2023) showed that neighborhoods
with high walkability and low social vulnerability had about 20% lower COVID-19
mortality rates compared to those with low walkability and high social
vulnerability. In addition, another study assessed the association between
residential county social vulnerability and leisure-time physical inactivity
among US adults, and found that compared to people living in counties in the
least vulnerable areas, those living in the mid-low, mid-high, and highest social
vulnerability quartiles had higher odds of being physically inactive during
leisure time (An & Xiang,
2015).
Another study by Bereitschaft (2023) also investigated
whether socially vulnerable populations had equitable access to walkable and
transit-accessible neighborhoods within America's largest metropolitan areas
founding a lower transit accessibility for high socially vulnerable populations
living in more walkable neighborhood. Given these previous findings, we deemed
it important to examine the role of social vulnerability moderating the
relationship between walkability and health. For example, greater walkability
may be significantly associated with health in more vulnerable neighborhoods that
lack transportation or other individual or environmental assets, but little
research has explored such issues to date.
In
addition to differences by social vulnerability, the relationship between walkability
and health may also vary in urban versus rural contexts (Fan et al., 2017). For example, one
study found that among urban youth, higher Walk Scores were linked to higher body
mass index (BMI) z-scores, while among rural youth, higher Walk Scores were
linked to lower BMI z-scores (Stowe et al.,
2019).
Likewise, a study of older adults reported that those residing in more
accessible environments, such as areas with continuous barrier-free sidewalks
and nearby public transportation, had 18% higher odds of belonging to the more
mobile group (Clarke &
Gallagher, 2013).
In contrast, a few studies found no differences in the relationship between
walkability and health by urban-rural categories (Bucko et al.,
2021; Kasehagen et al., 2012). Such variation in literature suggests the importance
of considering urbanicity in such an analysis as a stratifying variable. Multiple
studies in a similar scope have used Rural-Urban Commuting Area (RUCA) codes to
stratify their study settings into urban-rural categories (Adams et al.,
2025; Kasehagen et al., 2012; Makram et al., 2025). Thus, we employed
the same approach, stratifying our census tracts into urban and rural
categories using RUCA codes to better understand differences in how walkability
relates to health outcomes in different types of environments (U.S. Department of
Agriculture, Economic Research Service, 2025).
In
summary, while diverse studies have reported a relationship between walkability
and health, several important gaps remain in this research area. First, many
studies focus on the association between walkability and a single health outcome
or behavior (e.g., physical activity), but not multiple health issues
concurrently. Second, little research has considered the moderating effect of
social determinants of health, especially using a composite metric such as
social vulnerability (Edwards &
Dulai, 2018; Reis et al., 2013; Van Holle et al., 2014; Bereitschaft, 2017). Third, minimal
research about walkability and health, including variations by vulnerability, has
been conducted within the Southeastern US where disparities in environmental
justice and health equity are substantial (Bereitschaft,
2017, 2023; Bernhart et al., 2022). Finally, key differences may exist in
the association between walkability and health in rural versus urban areas, but
this has rarely been considered (Stowe et al.,
2019).
Given these limitations, the overall purpose of this study was to conduct an
equity analysis regarding walkability and its association with diverse health
issues related to mental and physical health (i.e., depression, poor mental
health, poor physical health, mobility disability, obesity, no leisure-time
physical activity) across all census tracts in South Carolina (SC). In
particular, we sought to answer the following research questions:
1. What is the
relationship between walkability and the aforementioned health issues and
behaviors?
2. Is the relationship
between walkability and these health issues and behaviors moderated by social
vulnerability?
3. Is the relationship
between walkability and these health issues and behaviors moderated by social
vulnerability different in urban versus rural areas?
The state of SC
provides a valuable setting in which to investigate such issues for multiple
reasons. First, SC demonstrates considerable variation in social vulnerability,
which makes it a preferable study setting to closely study how structural and
sociodemographic factors might influence the links between walkability and
health outcomes (Sonawane et al.,
2024).
Second, the state faces significant health challenges, such as high rates of
obesity, physical inactivity, and chronic disease (America’s Health
Rankings, 2021).
Finally, walkability across SC varies widely and has not been prioritized in
most community planning efforts. Therefore, these considerations make it
especially important to study how walkable environments affect health in this
area.
Overall, a better appreciation
of walkability and health outcomes and their variations by social vulnerability
and urbanicity/rurality can provide valuable insights and compelling evidence for
policymakers and planners to tailor interventions and design strategies to address
the unique health challenges faced by communities in SC.
Methods
Study Setting
This study examined
all census tracts within SC (n=1103). Census tracts were chosen as the
geographic unit of analysis in this study because they are widely used in
public health and urban planning research, offering standardized and consistent
boundaries for linking environmental and sociodemographic data. Unlike
considering buffer zones which focus on individualized spatial contexts, census
tracts allow for regional comparisons and facilitate integration with existing
datasets such as social vulnerability and various health outcomes. The
estimated land area of included tracts was approximately 30,064.28 square miles
with a population of 5,118,425 (US Census Bureau,
South Carolina, 2020).
Approximately 1 in 4 residents (26.0%) in SC identified as African American and
69.0% as White (US Census Bureau,
South Carolina, 2020).
In addition, 19.3% of the total population was 65 years or older, while 21.3% was
18 years or younger. The median household income in 2022 was $63,623, and 13.9%
of the population lived in poverty (US Census Bureau,
South Carolina, 2020).
Study Design
This study used a
cross-sectional design to analyze the association between neighborhood
walkability and health.
Measures
Neighborhood Walkability
To
measure the walkability of neighborhoods, the US Environmental Protection
Agency (EPA) created
the National Walkability Index to assign census block groups a score from 1
(least walkable) to 20 (most walkable) (J. Thomas &
Zeller, 2017; US EPA, 2021). Use of the National Walkability Index in both urban
and rural contexts has been well-documented (Moored et al.,
2024; Rockhill et al., 2025; Watson et al., 2020). The National Walkability Index (2021)
consists of three built environment metrics that affect whether people walk as
a mode of transportation: street intersection density, proximity to transit
stops, and land use diversity (Ewing &
Cervero, 2010).
The mean walkability of all block groups within a tract was calculated to obtain
a National Walkability Index value for each census tract in SC.
Health
Metrics
Multiple
health metrics for each census tract in SC were retrieved from the 2021 Population
Level Analysis and Community Estimates (PLACES) data source (CDC, 2022). The PLACES
program uses small area estimation and a multilevel regression and
poststratification approach, integrating geocoded health surveys with detailed
data from the CDC’s Behavioral Risk Factor Surveillance System (BRFSS), 5-year
American Community Survey estimates, and state- and county-level random effects,
to estimate the geographic distribution of population disease burden and health
behaviors for adults ages 18 years and older (CDC, 2023a).
Five
diverse health outcomes and one key health-risk behavior were obtained for each
census tract. These health metrics were chosen to represent diverse physical
and mental health outcomes and behaviors that have been linked to features of
the built environment, including walkability. Depression was the
percentage of people who reported
being told by a health professional they had a depressive disorder (CDC, 2024d). Poor mental
health was the percentage of residents who reported that their mental health
was not good for 14 or more days during the past 30 days (CDC, 2024c). Poor physical
health was the percentage of respondents who reported that their physical
health had not been good for 14 or more days during the past 30 days (CDC, 2024c). Mobility disability
was the proportion who answered “yes” to “Do you have serious difficulty
walking or climbing stairs?” (CDC, 2024). Obesity
was the percentage of respondents who had a BMI ≥30.0 kg/m² calculated from
self-reported weight and height (CDC, 2024). No leisure
time physical activity was those who reported not participating in any physical
activities or exercise outside their regular job (CDC, 2024b).
Social
Vulnerability
Data
on social vulnerability were collected for all census tracts in SC. The Social
Vulnerability Index was developed by the CDC using 2021 data and comprises four
sub-themes, including socioeconomic status, household composition and
disability, minority status and language, and housing type and transportation,
which collectively include 15 social factors. For each census tract in SC, a
percentile rank was obtained for each social factor as a value between 0 and 1,
with higher values indicating greater social vulnerability. Percentile ranks
for each dimension were then calculated by combining the respective social
factors, and an overall Social Vulnerability Index percentile was derived by calculating
the average percentile ranking values for the four dimensions (CDC, 2024a).
Urbanicity
Census
tracts were classified based on rurality/urbanicity using Rural Urban Community
Area (RUCA) codes that are derived according to measures of population density,
urbanization, and daily commuting (US Department of
Agriculture, Economic Research Service [USDA ERS], 2024). RUCA primary codes
ranging from 1 (most urban) to 10 (most rural) were combined into two
categories of urban (codes 1-6) versus rural (codes 7-10) (DeGuzman et al.,
2021; Mulrooney et al., 2023; USDA ERS, 2024).
Tract
Sociodemographic Characteristics
To
account for various sociodemographic characteristics, the following variables
were obtained for each tract from American Community Survey 5-year estimates
(2015–2019): 1) percentage of population under 125% of the federal poverty
threshold; 2) percentage unemployed; 3) median household income; 4) percentage with
less than high school education; 5) percentage 65 years or older; 6) percentage
17 years or younger; and 7) percentage racial/ethnic minority population.
Analysis
Descriptive
statistics were used to explore walkability, social vulnerability, various
health metrics and behaviors, and sociodemographic characteristics for all
census tracts. To address aim one, multilevel (mixed-effects) linear regression
models investigated
the association between census tract walkability and health outcomes (dependent
variables), while adjusting for social vulnerability and sociodemographic
covariates. To account for the hierarchical structure of the data, census
tracts (Level 1) were nested within counties (Level 2), and random intercepts
for counties were included to account for within-county clustering of
observations. For aim
two (i.e., how relationships between walkability and the health metrics vary by
social vulnerability), we conceptualized social vulnerability as a moderating
variable given prior evidence that structural and contextual factors may
influence how built environment characteristics relate to health outcomes. To
accomplish this, an interaction term between centered National Walkability
Index and centered Social Vulnerability Index percentile was added to the
models. Continuous variables included in interaction terms (i.e., National
Walkability Index and Social Vulnerability Index) were mean-centered to reduce
multicollinearity (centering was applied only in moderation analyses; aims 2
and 3). The Social Vulnerability Index was scaled from 0 to 1, representing
percentile ranking. Accordingly, regression coefficients can be interpreted in
meaningful increments (e.g., a 0.1 increase corresponding to a 10-percentile
increase). Afterward, values for simple slopes of the interaction between centered
National Walkability Index and centered Social Vulnerability Index were plotted
for each health variable. Simple slopes were computed for each health metric by
utilizing centered values of National Walkability Index and the overall Social
Vulnerability Index percentile ranking within the study sample. Finally, to
address aim 3, we again examined the relationship between walkability and
health metrics moderated by social vulnerability when tracts were stratified as
urban versus rural. Urbanicity was included as a stratifying variable in order
to assess potential heterogeneity in these associations across fundamentally
different contexts. All analyses were conducted in Stata 18 SE software (StataCorp, 2023) and tests were
considered significant at p<.05.
Results
Table 1 shows
descriptive statistics for all tracts in SC for all independent (National
Walkability Index and Social Vulnerability Index) and dependent (health
metrics) variables and covariates; 14 tracts were excluded due to missing data.
Overall, SC had 46 counties containing between 3 and
111 census tracts (M=5, SD= 33.83) considered for this study. On average, census
tract walkability scores were “below average” (M=6.89, SD=3.33, Range=1.00-18.70) (US EPA, 2021). The mean Social
Vulnerability Index for all tracts in SC was moderate (M=0.49, SD=0.28, Range=0.01-0.99).
Across all tracts, the mean rate of obesity (37.49%) was greatest among the
examined health metrics.
Walkability and Health Metrics Relationship
Moderated by Social Vulnerability Stratified by Urbanicity/Rurality
As shown in Table
3, taking into account the rural or urban classification of tracts altered the
relationship between walkability and some health metrics significantly.
Specifically, before including the interaction of National Walkability Index
and Social Vulnerability Index, the association between walkability and poor
mental health was significant only in urban tracts (B=-.05, SE=.02, p<0.01),
while this association remained significant for poor physical health, obesity,
and no leisure time physical activity. However, for mobility disability, this
association became statistically significant among rural tracts (B=-.42,
SE=.11, p<0.001). When adding the moderating effect of social
vulnerability to the model, the relationships between walkability and obesity
(B=.20, SE=.07, p<0.01) became positive and significant only in urban
tracts. On the other hand, the relationship between walkability and mobility
disability (B=.81, SE=.37, p<0.05) and walkability and no
leisure-time physical activity (B=.84, SE=.39, p<0.05) turned
positive and significant only in rural tracts.
Discussion
This study
explored the relationship between neighborhood walkability and various health
issues and behaviors in SC, with a focus on the moderating role of
social vulnerability and the classification of urbanicity/rurality. In doing
so, we demonstrate that the health benefits of walkable environments are not
shared equally, especially among socially vulnerable groups. Specifically, the findings
of this study provide valuable insights into the significant inverse
relationship between walkability and most health issues and behaviors and how
this varied at different levels of social vulnerability. In addition, the
observed variation between counties, as indicated by intraclass correlations in
our results, suggests that contextual, county-level factors are associated with
differences in health outcomes. These results emphasize the potential of
walkable neighborhoods to mitigate the prevalence of chronic diseases and risky
behaviors contributing to physical and mental health, thereby promoting public
health at the community level. Our findings also highlight the importance of
examining such issues within an environmental justice lens and considering walkability
may not be uniform and equally beneficial and available to all.
Walkability and Health Metrics
Across this sample
of SC census tracts, higher levels of walkability were significantly and
negatively associated with numerous health metrics, including poor mental
health, poor physical health, obesity, and no leisure time physical activity. These
findings are consistent with prior research, as several studies have reported an
inverse association between neighborhood walkability and the prevalence of
chronic diseases, depression, and cardiovascular diseases (Howell,
Tu, Moineddin, Chu, et al., 2019; Keats et al., 2020; Koohsari et al., 2019). For example, one
study by Yoon et al. (2017) showed that lower walkability scores in
neighborhoods in California were linked to less walking behavior among
individuals, ultimately leading to poor mental health. In terms of physical
health status, Wang et al. (2023) found that
compared to those in neighborhoods with low walkability level, participants in
highly walkability neighborhoods had increased odds of sufficient physical
activity and decreased odds of obesity. Similarly, many studies proved a
negative association between neighborhood walkability and BMI and obesity (King et
al., 2011; Smith et al., 2008; Stowe et al., 2019; Van Cauwenberg et al., 2016;
Wang et al., 2023).
Considering
such negative associations is vital, especially in SC, where these risk factors
are among the most prevalent health concerns and causes of mortality (CDC, 2023b; South
Carolina Department of Public Health, 2024). Another study by de Sa and Arden (2014) demonstrated that individuals
living in highly walkable areas (upper quartiles of the walkability index) are
more likely to engage in leisure walking or cycling compared to those in less
walkable areas. Documenting such negative associations could bring attention to
the significance of walkability when redesigning the built environment to enhance
population health and well-being.
Walkability and Health Metrics Moderated
by Social Vulnerability
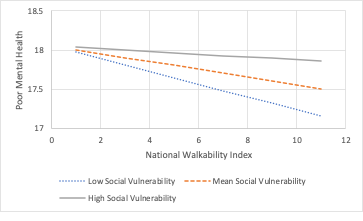
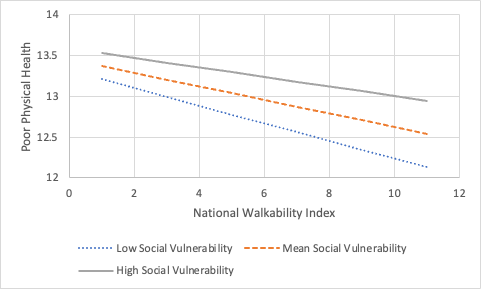
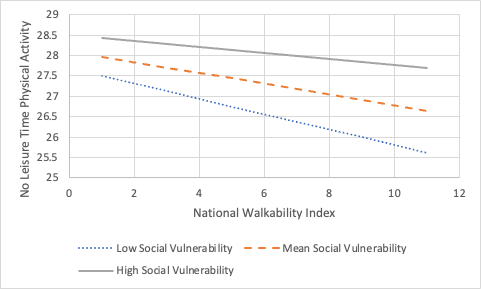
The association
between walkability and the considered health metrics was moderated by social
vulnerability for three health outcomes and a health risk behavior: poor mental
health, poor physical health, obesity, and no leisure-time physical activity. Specifically,
across all levels of social vulnerability, the rate of these health issues and
behaviors decreased as walkability of neighborhoods increased. Also, except for
obesity, the rate of these outcomes was greatest in high socially vulnerable
areas and the lowest in low socially vulnerable areas. There may be multiple
reasons for these findings. First, neighborhoods with high social vulnerability
often face additional barriers, such as safety concerns, inadequate
infrastructure, or fewer recreational facilities, which may limit the extent to
which increased walkability translates into health benefits (Fordham et
al., 2013; S. Liu et al., 2023; McKenzie et al., 2013). Second, individuals
in low socially vulnerable areas may have greater access to resources, such as
well-maintained sidewalks, green spaces, or community programs, that amplify
the positive effects of walkability on health (Bereitschaft, 2023;
Bereitschaft, 2017;
Y. Liu et al., 2024). These findings
suggest that while walkability is beneficial across all communities, efforts to
improve neighborhood environments in highly socially vulnerable areas are
critical to reducing health disparities.
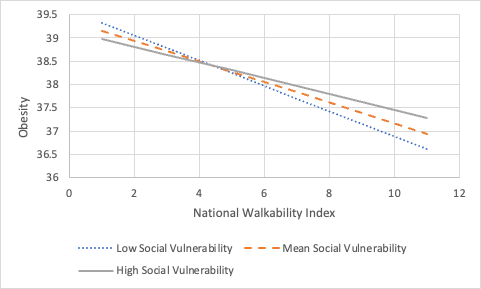
On the other hand,
the prevalence of obesity in neighborhoods with low walkability was more
pronounced in areas with low social vulnerability but showed the greatest
reduction as walkability increased. In contrast, while individuals in high
social vulnerability areas had the lowest obesity rates in low-walkability
neighborhoods, they experienced the smallest reduction in obesity as
walkability improved. Several factors could help explain these observed
patterns. For example, in low social vulnerability areas with low walkability,
residents might rely more on car transportation and sedentary behaviors due to
the design of their neighborhoods (Chakrabarti &
Shin, 2017).
These behaviors could contribute to higher obesity rates despite their lower
social vulnerability. In terms of the sharpest decline in the rate of obesity
in areas with low social vulnerability as walkability increases, residents may
be better positioned to take advantage of improvements in high walkable areas
due to access to complementary resources (e.g., better-maintained sidewalks,
recreational facilities, and safer environments) (Høyer-Kruse et
al., 2024).
Also, cultural or lifestyle differences across neighborhoods could play a role,
where residents in low social vulnerability areas may already be more inclined
to adopt physical activity behaviors that align with increased walkability
compared to those in high social vulnerability areas.
Walkability and Health Metrics
Moderated by Social Vulnerability and Stratified by Urbanicity/Rurality
While several
prior studies have examined the relationship between walkability and multiple
health metrics mentioned above, only a few have considered interaction
effects between National Walkability Index and Social Vulnerability Index
or based on urbanicity or rurality (Baobeid et al.,
2021; Kowaleski-Jones et al., 2018; Lovasi et al., 2011; Rohrer et al., 2004;
Van Cauwenberg et al., 2016; Wang et al., 2023; Howell, Tu, Moineddin, Chen, et al.,
2019; Wali, 2023).
According to our findings, the relationship between walkability and health
varied depending on the interaction between National Walkability Index and Social
Vulnerability Index and whether the tracts were in rural or urban areas. Specifically,
the association between walkability and several health metrics (i.e., poor
physical health, obesity, and no leisure time physical activity) was
significant and negative in both urban and rural tracts. However, these
associations became positive in both rural and urban areas after considering
the moderation effect of social vulnerability. Such unexpected observations
might be due to the complex interplay between social vulnerability and access
to resources in both urban and rural areas. For instance, in socially
vulnerable neighborhoods, even in walkable environments, barriers such as
economic hardship, limited access to healthcare, healthy food options, safety
concerns, or poorly maintained infrastructure may reduce the potential benefits
of walkability, independent of urbanicity/rurality (Bereitschaft,
2023).
Recognizing how the
association between walkability and health outcomes differs in rural versus
urban areas, including variations by social vulnerability, is critical to
understanding and promoting physical and mental health statuses in these
diverse settings. Particularly, in urban areas, where infrastructure and
destinations are typically more concentrated, increased walkability often leads
to greater opportunities for better overall health and improved access to
resources (Westenhöfer et
al., 2023).
However, in socially vulnerable urban neighborhoods, these benefits are
frequently limited by factors such as safety concerns and economic barriers (Bereitschaft,
2023).
In contrast, in rural settings with high social vulnerability, there might be fewer
organized and sustained community programs promoting health and wellness,
leading to isolation, loneliness, and reduced participation in social or
physical activities, causing several health-concerning consequences, such as an
increased rate of mobility disability and no leisure time physical activity (Shediac-Rizkallah
& Bone, 1998; Williams et al.,
2022). One study by
Thielman et al. (2015) showed that in
small towns, the rate of no leisure time physical activity was lower in areas
with higher walkability. These risk factors may be multiplied by a lack of strategies
targeting enhancing connectivity, addressing transportation gaps, and tailoring
walkable infrastructure to better serve dispersed populations. Also, the fear
of being unsafe and insecure in high vulnerability-urban areas could prevent
people from engaging in physical activities even with greater walkability in
their neighborhoods (Chupak et al.,
2025).
Implications for Research and
Practice
This study lends
itself to a wealth of ideas for future research and practice. To begin, taking
into account the complex relationship between walkability and health
metrics moderated by social vulnerability and stratified by
urbanicity/rurality, future studies could potentially focus on each of these
directions further to obtain more nuanced findings (e.g., examining specific neighborhood
design elements, individual versus community health behavior/outcomes, particular
social determinants of health). In addition, other neighborhood factors
contributing to health beyond walkability, such as aesthetics and safety, are
additional environmental factors that merit examination. Also, the present
methodology could be replicated in different states and regions with diverse
levels of walkability, health, vulnerability, and urbanicity, and the results
compared with each other. Researchers should also explore the preliminary
relationships identified here in more detail, such as better understanding the
thresholds or augmentations in walkability necessary to impact or achieve various
health objectives (e.g., a 5% reduction in no leisure time physical activity).
Finally, future analyses could also parse out which components of the Social
Vulnerability Index most strongly moderate the effects of walkability on
health, or develop a vulnerability-adjusted walkability framework that
delineates Social Vulnerability Index thresholds at which the benefits of
walkability are attenuated.
Regarding
implications for policymakers and public health professionals, our findings provide
preliminary support for embracing greater walkability to be associated
with better mental and physical health (Zhu et al., 2013). As such
improvements are made in communities, more natural intervention research is
needed to ascertain and more rigorously document the longitudinal impacts of
enhanced walkability (Acciai et al.,
2023; Goon et al., 2020; White et al., 2021). In addition, problems specific to urban
(e.g., traffic, crowded spaces) and rural (e.g., lack of resources) contexts
require implementing community-based interventions to target health issues
effectively and efficiently. Another critical finding beneficial for decision-makers is
to consider the moderation effect of social vulnerability on the relationship
between walkability and different health metrics. For example, efforts to
increase walkability may need to be combined with (or follow) policies and
programs that ameliorate social vulnerability barriers which may be impeding the
potential association of a walkable neighborhood with improved health. Overall,
as more is learned about how walkability is associated with health in diverse
contexts, more robust evidence (e.g., additional studies, longitudinal study
designs) will be valuable to reinforce the preliminary findings reported here.
In the meantime, studies such as the present one provide a replicable,
cost-effective means of surveillance and predictive modeling for better
understanding and forecasting the impacts of improved walkability on health. By
integrating accessible environmental and public health datasets from the EPA,
CDC, and other organizations, states and communities can develop risk
stratification profiles (e.g., for cities, neighborhoods, council/planning
districts) and prioritize where walkability interventions may be most fruitful.
Strengths and
Limitations
This study had a
number of limitations. First, its cross-sectional design limits the ability to
infer causality, and it is possible that healthy people may opt to live in more
walkable environments (an issue of self-selection). Second, this research used
the National Walkability Index, an index developed initially to assess
individual-level physical activity, as a measure to investigate broader health
outcomes on an ecological scale. While walkability indices provide valuable
insights into neighborhood-level characteristics that influence physical
activity, they may not directly capture the built environment and other social
determinants of health. The National Walkability Index, including its current
components, street intersection density, proximity to transit stops, and land
use diversity, may also be less relevant in rural areas. Indeed, traditional
walkability measurements are often inadequate for individuals living outside
urban areas, as these metrics typically do not consider walking that is not
directed toward a specific amenity. Future research needs to develop tools and
metrics that can reliably measure walkability in rural communities and provide easily
accessible results based on physical addresses. These tools should incorporate
assessments of sidewalks, safe street crossings, town centers, trails, parks,
other green spaces, and rural-specific destinations, like relaxing places and
additional safety considerations (Maddock et al.,
2024).
Third, although this study integrated diverse secondary data from multiple reliable
sources, including primary data about walkability and/or health may yield
additional insights. In addition, other relevant variables, such as
neighborhood greenery and aesthetics of the built environment, were not
considered. Fourth, our approach is subject to the modifiable areal unit
problem, where the results may vary depending on how the geographic boundaries
of analysis are defined, influencing the observed relationships between
walkability and health outcomes (Diez Roux, 2001,
2008).
Census tracts in SC differ in size, demographic makeup, and socioeconomic
status, can change borders gradually, and may span multiple neighborhoods. Therefore,
it is possible to grasp only a fraction of this diversity and complexity when
assessing walkability and health metrics at the census tract level. Finally,
since this study uses aggregate data at the census tract level, the findings
may be affected by ecological fallacy, in that patterns observed in
neighborhoods might not apply to individuals, which could limit the
generalizability of the results.
On the other hand,
this study has several strengths worth mentioning. First and foremost, we
considered the relationship between walkability and several health metrics relevant
to mental and physical health simultaneously. Second, to our
knowledge, no study to date has considered such relationships in the
context of an interaction between National Walkability Index and Social
Vulnerability Index. Third, including RUCA classifications (i.e.,
stratifying by urban and rural areas) and focusing on a state with diverse and
egregious geographic and sociodemographic health disparities provided insightful
results regarding the association between walkability and health metrics in varied
contexts.
Conclusion
In conclusion, our
findings showed that higher walkability was associated with lower prevalence of
several health outcomes and risk behaviors. In addition, greater walkability in
low and medium socially vulnerable areas was negatively associated with
multiple health outcomes, while higher walkability was not associated with some
health outcomes in high socially vulnerable areas. However, these relationships
varied when considering urbanicity/rurality. The insights gained from this
study can be used to develop relevant interventions and policies to consider
walkability (e.g., improving infrastructure such as sidewalks, green spaces,
and access to essential services) alongside social vulnerability (e.g.,
addressing systemic barriers like economic inequality), based on the specific
contexts and associated issues to promote population health and well-being.
Correspondence should be
addressed to
Andrew T. Kaczynski
Department of Health Promotion, Education,
and Behavior
Arnold School of Public Health, University
of South Carolina
915 Greene Street, Room 539
Columbia, SC, 29208
atkaczyn@mailbox.sc.edu
(803) 777-7063
 Farnaz
Hesam Shariati: 0000-0002-2892-4104
Farnaz
Hesam Shariati: 0000-0002-2892-4104
Anna
L. Chupak: 0000-0002-8917-2145
Erin
Looney: 0000-0002-2218-7676
Shirelle
H. Hallum: 0009-0008-1805-2665
Mojtaba
Kazemian: 0009-0000-5458-2382
Acknowledgements
Not applicable
Ethics Approval and Consent to
Participate
Not applicable. We used datasets that are
publicly available.
https://data.cdc.gov/500-Cities-Places/PLACES-Local-Data-for-Better-Health-County-Data-20/swc5-untb/explore
https://www.census.gov/acs/www/data/data-tables-and-tools/data-profiles/
https://www.epa.gov/smartgrowth/national-walkability-index-user-guide-and-methodology
https://www.ers.usda.gov/data-products/rural-urban-commuting-area-codes/documentation/
Consent for Publication
Not applicable
Conflict of Interest Statement
The authors declare that they have no
competing interests.
Authors’ Contributions
F.HS. was in charge of formal analysis,
investigation, data curation, writing and original draft preparation, and
visualization. A.L.C. was in charge of formal analysis, data curation, writing,
and reviewing. S.H.H. was in charge of data curation. E.L., C.M.M., and M.K.
were in charge of writing and reviewing extensively. A.T.K. was in charge of
project administration, methodology, data curation, writing original draft
preparation, writing and reviewing, and funding acquisition. All authors have
read and agreed to the published version of the manuscript.
Funding
This study was supported by the University
of South Carolina, Office of Research.
List of Abbreviations
BMI:
Body Mass Index
BRFSS:
Behavioral Risk Factor Surveillance System
CDC:
Centers for Disease Control and Prevention
EPA:
Environmental Protection Agency
PLACES:
Population Level Analysis and Community Estimates
RUCA:
Rural Urban Community Area
SC:
South Carolina
US:
United States
Creative Commons License
This work is licensed
under a Creative
Commons Attribution-Noncommercial 4.0 International License (CC BY-NC 4.0).
References
Acciai,
F., DeWeese, R. S., Lloyd, K., Yedidia, M. J., Kennedy, M., DiSantis, K. I.,
Tulloch, D., & Ohri-Vachaspati, P. (2023). The relationship between changes
in neighborhood physical environment and changes in physical activity among
children: A prospective cohort study. International Journal of Behavioral
Nutrition and Physical Activity, 20(1), 82.
https://doi.org/10.1186/s12966-023-01478-2
Adams, M. C. B., Hudson, C. L., Perkins,
M. L., Hurley, R. W., & Topaloglu, U. (2025). Leveraging the Rural-Urban
Commuting Area Tool to Address Geographic Disparities in Cancer Care: A
Dual-Application Framework for Institutional and National Initiatives. JCO
Clinical Cancer Informatics, (9), e2500122.
https://doi.org/10.1200/CCI-25-00122
America’s Health Rankings. (2021).
America’s Health Rankings.
https://www.americashealthrankings.org/publications/reports/2021-disparities-report/state-summaries-south-carolina
An, R., & Xiang, X. (2015). Social
vulnerability and leisure-time physical inactivity among US adults. American
Journal of Health Behavior, 39(6), 751–760.
Anderson, E., & Durstine, J. L.
(2019). Physical activity, exercise, and chronic diseases: A brief review. Sports
Medicine and Health Science, 1(1), 3–10.
Andrew, M. K. (2015). Frailty and social
vulnerability. Frailty in Aging, 41, 186–195.
Asiamah, N., Vieira, E. R., Gasana, J.,
Conduah, A. K., & Eduafo, R. (2023). The moderating influences of social
networks on the relationship between neighbourhood walkability and sedentary
behaviour in community-dwelling older adults in Accra, Ghana. Journal of
Public Health, 31(5), 789–798.
Baobeid, A., Koç, M., & Al-Ghamdi, S.
G. (2021). Walkability and its relationships with health, sustainability, and
livability: Elements of physical environment and evaluation frameworks. Frontiers
in Built Environment, 7, 721218.
Bereitschaft, B. (2017). Equity in
neighbourhood walkability? A comparative analysis of three large US cities. Local
Environment, 22(7), 859–879.
Bereitschaft, B. (2023). Do socially
vulnerable urban populations have access to walkable, transit-accessible
neighborhoods? A nationwide analysis of large US metropolitan areas. Urban
Science, 7(1), 6.
Bernhart, J. A., Wende, M. E., Kaczynski,
A. T., Wilcox, S., Dunn, C. G., & Hutto, B. (2022). Assessing the
walkability environments of churches in a rural southeastern county of the
United States. Journal of Public Health Management and Practice, 28(1),
E170–E177.
Booth, F. W., Roberts, C. K., Thyfault, J.
P., Ruegsegger, G. N., & Toedebusch, R. G. (2017). Role of Inactivity in
Chronic Diseases: Evolutionary Insight and Pathophysiological Mechanisms. Physiological
Reviews, 97(4), 1351–1402.
https://doi.org/10.1152/physrev.00019.2016
Brown, A. F., Ma, G. X., Miranda, J., Eng,
E., Castille, D., Brockie, T., Jones, P., Airhihenbuwa, C. O., Farhat, T., Zhu,
L., & Trinh-Shevrin, C. (2019). Structural Interventions to Reduce and
Eliminate Health Disparities. American Journal of Public Health, 109(S1),
S72–S78. https://doi.org/10.2105/AJPH.2018.304844
Bucko, A. G., Porter, D. E., Saunders, R.,
Shirley, L., Dowda, M., & Pate, R. R. (2021). Walkability indices and
children’s walking behavior in rural vs. Urban areas. Health & Place,
72, 102707. https://doi.org/10.1016/j.healthplace.2021.102707
CDC. (2022). Data.CDC.Gov.
https://data.cdc.gov/500-Cities-Places/PLACES-Local-Data-for-Better-Health-County-Data-20/swc5-untb/explore
CDC. (2023a, July 18). PLACES
Methodology. Centers for Disease Control and Prevention.
https://www.cdc.gov/places/methodology/index.html
CDC. (2023b, September 13). South
Carolina. https://www.cdc.gov/nchs/pressroom/states/southcarolina/sc.htm
CDC. (2024a). CDC/ATSDR/Social
Vulnerability Index. https://hazards.fema.gov/nri/social-vulnerability
CDC. (2024b). Health Risk Behaviors.
PLACES: Local Data for Better Health.
https://www.cdc.gov/places/measure-definitions/health-risk-behaviors.html
CDC. (2024c). Health Status.
PLACES: Local Data for Better Health.
https://www.cdc.gov/places/measure-definitions/health-status.html
CDC. (2024d). Methodology. PLACES:
Local Data for Better Health. https://www.cdc.gov/places/methodology/index.html
CDC. (2024e, November 6). Adult
Physical Inactivity Outside of Work. Physical Activity.
https://www.cdc.gov/physical-activity/php/data/inactivity-maps.html
Centers for Disease Control and Prevention
[CDC]. (2024). Health Outcomes. PLACES: Local Data for Better Health.
https://www.cdc.gov/places/measure-definitions/health-outcomes.html
Chakrabarti, S., & Shin, E. J. (2017).
Automobile dependence and physical inactivity: Insights from the California
Household Travel Survey. Journal of Transport & Health, 6,
262–271.
Chupak, A. L., Hallum, S. H., Shariati, F.
H., Looney, E., & Kaczynski, A. T. (2025). Identifying disparities in the
relationship between neighborhood walkability and active transportation safety
within South Carolina. Journal of Transport & Health, 41,
101960.
Clarke, P., & Gallagher, N. A. (2013).
Optimizing Mobility in Later Life: The Role of the Urban Built Environment for
Older Adults Aging in Place. Journal of Urban Health, 90(6),
997–1009. https://doi.org/10.1007/s11524-013-9800-4
de Sa, E., & Ardern, C. I. (2014).
Neighbourhood walkability, leisure-time and transport-related physical activity
in a mixed urban–rural area. PeerJ, 2, e440.
DeGuzman, P. B., Huang, G., Lyons, G.,
Snitzer, J., & Keim-Malpass, J. (2021). Rural Disparities in Early
Childhood Well Child Visit Attendance. Journal of Pediatric Nursing, 58,
76–81. https://doi.org/10.1016/j.pedn.2020.12.005
Diez Roux, A. V. (2001). Investigating
neighborhood and area effects on health. American Journal of Public Health,
91(11), 1783–1789.
Diez Roux, A. V. (2008). Next steps in
understanding the multilevel determinants of health. Journal of Epidemiology
and Community Health, 62(11), 957–959.
https://doi.org/10.1136/jech.2007.064311
Diez-Roux, A. V. (2003). Residential
Environments and Cardiovascular Risk. Journal of Urban Health: Bulletin of
the New York Academy of Medicine, 80(4), 569–589.
https://doi.org/10.1093/jurban/jtg065
Diez-Roux, A. V. (2007). Neighborhoods and
health: Where are we and were do we go from here? Revue
d’epidemiologie et de Sante Publique, 55(1),
13–21.
Diez-Roux, A. V. (2016). Neighborhoods
and health: What do we know? What should we do? American Journal of Public
Health, 106(3), 430.
Diez-Roux, A. V., & Mair, C. (2010).
Neighborhoods and health. Annals of the New York Academy of Sciences, 1186(1),
125–145. https://doi.org/10.1111/j.1749-6632.2009.05333.x
Diez-Roux, A. V., Schwartz, S., &
Susser, E. (2017). Ecological variables, ecological studies,
and multilevel studies in public health research. Oxford Textbook of Global
Public Health, 411, 493–507.
Edwards, N., & Dulai, J. (2018).
Examining the relationships between walkability and physical activity among
older persons: What about stairs? BMC Public Health, 18, 1–11.
Ewing, R., & Cervero, R. (2010).
Travel and the built environment: A meta-analysis. Journal of the American
Planning Association, 76(3), 265–294.
Fan, J. X., Wen, M., & Wan, N. (2017).
Built environment and active commuting: Rural-urban differences in the U.S. SSM
- Population Health, 3, 435–441.
https://doi.org/10.1016/j.ssmph.2017.05.007
Fordham, M., Lovekamp, W. E., Thomas, D.
S., & Phillips, B. D. (2013). Understanding social vulnerability. Social
Vulnerability to Disasters, 2, 1–29.
Foster, S., & Giles-Corti, B. (2008).
The built environment, neighborhood crime and constrained physical activity: An
exploration of inconsistent findings. Preventive Medicine, 47(3),
241–251.
Goon, S., Kontulainen, S., &
Muhajarine, N. (2020). Neighborhood built environment measures and association
with physical activity and sedentary time in 9–14-year-old children in
Saskatoon, Canada. International Journal of Environmental Research and
Public Health, 17(11), 3837.
Gordon-Larsen, P., Nelson, M. C., Page,
P., & Popkin, B. M. (2006). Inequality in the built environment underlies
key health disparities in physical activity and obesity. Pediatrics, 117(2),
417–424.
Hansmann, K. J., Grabow, M., &
McAndrews, C. (2022). Health equity and active transportation: A scoping review
of active transportation interventions and their impacts on health equity. Journal
of Transport & Health, 25, 101346.
Harris, M. A. (2018). The relationship
between physical inactivity and mental wellbeing: Findings from a
gamification-based community-wide physical activity intervention. Health
Psychology Open, 5(1), 2055102917753853.
https://doi.org/10.1177/2055102917753853
Howell, N. A., Tu, J. V., Moineddin, R.,
Chen, H., Chu, A., Hystad, P., & Booth, G. L. (2019). Interaction between
neighborhood walkability and traffic-related air pollution on hypertension and
diabetes: The CANHEART cohort. Environment International, 132,
104799.
Howell, N. A., Tu, J. V., Moineddin, R.,
Chu, A., & Booth, G. L. (2019). Association Between Neighborhood
Walkability and Predicted 10‐Year Cardiovascular Disease Risk: The CANHEART
(Cardiovascular Health in Ambulatory Care Research Team) Cohort. Journal of
the American Heart Association, 8(21), e013146.
https://doi.org/10.1161/JAHA.119.013146
Høyer-Kruse, J., Schmidt, E. B., Hansen,
A. F., & Pedersen, M. R. L. (2024). The interplay between social
environment and opportunities for physical activity within the built
environment: A scoping review. BMC Public Health, 24(1), 2361.
https://doi.org/10.1186/s12889-024-19733-x
Kaczynski, A. T. (2010). Neighborhood
walkability perceptions: Associations with amount of neighborhood-based
physical activity by intensity and purpose. Journal of Physical Activity and
Health, 7(1), 3–10.
Kaczynski, A. T., Robertson-Wilson, J.,
& Decloe, M. (2012). Interaction of perceived neighborhood walkability and
self-efficacy on physical activity. Journal of Physical Activity and Health,
9(2), 208–217.
Kasehagen, L., Busacker, A., Kane, D.,
& Rohan, A. (2012). Associations Between Neighborhood Characteristics and
Physical Activity Among Youth Within Rural–Urban Commuting Areas in the US. Maternal
and Child Health Journal, 16(S2), 258–267.
https://doi.org/10.1007/s10995-012-1188-3
Keats, M. R., Cui, Y., DeClercq, V.,
Grandy, S. A., Sweeney, E., & Dummer, T. J. (2020). Associations between
neighborhood walkability, physical activity, and chronic disease in Nova
Scotian adults: An Atlantic PATH cohort study. International Journal of
Environmental Research and Public Health, 17(22), 8643.
King, A. C., Sallis, J. F., Frank, L. D.,
Saelens, B. E., Cain, K., Conway, T. L., Chapman, J. E., Ahn, D. K., &
Kerr, J. (2011). Aging in neighborhoods differing in walkability and income:
Associations with physical activity and obesity in older adults. Social
Science & Medicine, 73(10), 1525–1533.
https://doi.org/10.1016/j.socscimed.2011.08.032
Kocjan, G. Z., Avsec, A., & Kavčič, T.
(2024). Feeling too low to be active: Physical inactivity mediates the
relationship between mental and physical health. Social Science &
Medicine, 341, 116546.
Koohsari, M. J., McCormack, G. R., Nakaya,
T., Shibata, A., Ishii, K., Yasunaga, A., Hanibuchi, T., & Oka, K. (2019).
Urban design and Japanese older adults’ depressive symptoms. Cities, 87,
166–173.
Kowaleski-Jones, L., Zick, C., Smith, K.
R., Brown, B., Hanson, H., & Fan, J. (2018). Walkable neighborhoods and
obesity: Evaluating effects with a propensity score approach. SSM-Population
Health, 6, 9–15.
Kumar, S., & Preetha, G. S. (2012).
Health promotion: An effective tool for global health. Indian Journal of
Community Medicine: Official Publication of Indian Association of Preventive
& Social Medicine, 37(1), 5.
Kurth, T., Gaziano, J. M., Berger, K.,
Kase, C. S., Rexrode, K. M., Cook, N. R., Buring, J. E., & Manson, J. E.
(2002). Body mass index and the risk of stroke in men. Archives of Internal
Medicine, 162(22), 2557–2562.
Laddu, D., Paluch, A. E., & LaMonte,
M. J. (2021). The role of the built environment in promoting movement and
physical activity across the lifespan: Implications for public health. Progress
in Cardiovascular Diseases, 64, 33–40.
Lauwers, L., Leone, M., Guyot, M.,
Pelgrims, I., Remmen, R., Van den Broeck, K., Keune, H., & Bastiaens, H.
(2021). Exploring how the urban neighborhood environment influences mental
well-being using walking interviews. Health & Place, 67,
102497.
Lavie, C. J., Ozemek, C., Carbone, S.,
Katzmarzyk, P. T., & Blair, S. N. (2019). Sedentary Behavior, Exercise, and
Cardiovascular Health. Circulation Research, 124(5), 799–815.
https://doi.org/10.1161/CIRCRESAHA.118.312669
Leslie, E., Coffee, N., Frank, L., Owen,
N., Bauman, A., & Hugo, G. (2007). Walkability of local communities: Using
geographic information systems to objectively assess relevant environmental
attributes. Health & Place, 13(1), 111–122.
Leyden, K. M. (2003). Social capital and
the built environment: The importance of walkable neighborhoods. American
Journal of Public Health, 93(9), 1546–1551.
Link, B. G., & Phelan, J. (1995).
Social conditions as fundamental causes of disease. Journal of Health and
Social Behavior, 80–94.
Liu, S., Morin, S. B., Bourand, N. M.,
DeClue, I. L., Delgado, G. E., Fan, J., Foster, S. K., Imam, M. S., Johnston,
C. B., & Joseph, F. B. (2023). Social vulnerability and risk of suicide in
US adults, 2016-2020. JAMA Network Open, 6(4), e239995–e239995.
Liu, Y., Gu, X., Wang, Z., & Anderson,
A. (2024). Urban greenery distribution and its link to social vulnerability. Urban
Forestry & Urban Greening, 101, 128542.
Lovasi, G. S., Grady, S., & Rundle, A.
(2011). Steps forward: Review and recommendations for research on walkability,
physical activity and cardiovascular health. Public Health Reviews, 33(2),
484–506.
Macintyre, S., Ellaway, A., & Cummins,
S. (2002). Place effects on health: How can we conceptualise, operationalise
and measure them? Social Science & Medicine, 55(1), 125–139.
Maddock, J. E., Perry, C., Seguin-Fowler,
R., Diekman, N. F., Currier, J., Winkle, J., Lenstra, N., & Franklin, H.
(2024). Is Walk Score a useful tool for measuring walkability in rural
communities? The Journal of Rural Health: Official Journal of the American
Rural Health Association and the National Rural Health Care Association, 41(2),
e12895.
Mah, J., Rockwood, K., Stevens, S., Keefe,
J., & Andrew, M. K. (2023). Do interventions reducing social vulnerability
improve health in community dwelling older adults? A systematic review. Clinical
Interventions in Aging, 447–465.
Makram, O. M., Pan, A., Parekh, T.,
Maddock, J. E., & Kash, B. (2025). Exploring the relationship between
neighborhood walkability and mental health: A study of urban areas in Texas. Heliyon,
11(4).
https://www.cell.com/heliyon/fulltext/S2405-8440(25)01091-6?uuid=uuid%3A6fba79c2-9452-41ab-b800-a2447c5dd117
Mazumdar, S., Learnihan, V., Cochrane, T.,
& Davey, R. (2018). The built environment and social capital: A systematic
review. Environment and Behavior, 50(2), 119–158.
McCormack, G. R., Spence, J. C., McHugh,
T.-L., & Mummery, W. K. (2022). The effect of neighborhood walkability on
changes in physical activity and sedentary behavior during a 12-week
pedometer-facilitated intervention. PLOS ONE, 17(12), e0278596.
https://doi.org/10.1371/journal.pone.0278596
McKenzie, T. L., Moody, J. S., Carlson, J.
A., Lopez, N. V., & Elder, J. P. (2013). Neighborhood income matters:
Disparities in community recreation facilities, amenities, and programs. Journal
of Park and Recreation Administration, 31(4), 12.
Moored, K. D., Crane, B. M., Carlson, M.
C., Dunlap, P. M., Brach, J. S., & Rosso, A. L. (2024). Neighborhood
walkability is associated with global positioning system-derived community
mobility of older adults. The Journals of Gerontology, Series A: Biological
Sciences and Medical Sciences, 79(7), glae132.
Mulrooney, T., Liang, C.-L., Kurkalova, L.
A., McGinn, C., & Okoli, C. (2023). Quantitatively defining and mapping
rural: A case study of North Carolina. Journal of Rural Studies, 97,
47–56. https://doi.org/10.1016/j.jrurstud.2022.11.011
National Heart, Lung, and Blood Institute.
(2022). Overweight and Obesity-NIH.
https://www.nhlbi.nih.gov/health/overweight-and-obesity/causes
National Institute of Mental Health.
(2021). Major Depression—National Institute of Mental Health (NIMH).
https://www.nimh.nih.gov/health/statistics/major-depression
Ohrnberger, J., Fichera, E., & Sutton,
M. (2017). The relationship between physical and mental health: A
mediation analysis. Social Science & Medicine, 195, 42–49.
Pan, A., Sun, Q., Okereke, O. I., Rexrode,
K. M., & Hu, F. B. (2011). Depression and risk of stroke morbidity and
mortality: A meta-analysis and systematic review. Jama, 306(11),
1241–1249.
Penninx, B. W., Beekman, A. T., Honig, A.,
Deeg, D. J., Schoevers, R. A., Van Eijk, J. T., & Van Tilburg, W. (2001).
Depression and cardiac mortality: Results from a community-based longitudinal
study. Archives of General Psychiatry, 58(3), 221–227.
Pereira, M. F., Vale, D. S., &
Santana, P. (2023). Is walkability equitably distributed across socio-economic
groups?–A spatial analysis for Lisbon metropolitan area. Journal of
Transport Geography, 106, 103491.
Powell-Wiley, T. M., Poirier, P., Burke,
L. E., Després, J.-P., Gordon-Larsen, P., Lavie, C. J., Lear, S. A., Ndumele,
C. E., Neeland, I. J., Sanders, P., St-Onge, M.-P., & On behalf of the
American Heart Association Council on Lifestyle and Cardiometabolic Health;
Council on Cardiovascular and Stroke Nursing; Council on Clinical Cardiology;
Council on Epidemiology and Prevention; and Stroke Council. (2021). Obesity and
Cardiovascular Disease: A Scientific Statement From the American Heart
Association. Circulation, 143(21).
https://doi.org/10.1161/CIR.0000000000000973
Rees-Punia, E., Hathaway, E. D., &
Gay, J. L. (2018). Crime, perceived safety, and physical activity: A
meta-analysis. Preventive Medicine, 111, 307–313.
Reis, R. S., Hino, A. A. F., Rech, C. R.,
Kerr, J., & Hallal, P. C. (2013). Walkability and physical activity:
Findings from Curitiba, Brazil. American Journal of Preventive Medicine,
45(3), 269–275.
Riggs, W. (2016). Inclusively walkable:
Exploring the equity of walkable housing in the San Francisco Bay Area. Local
Environment, 21(5), 527–554.
Riggs, W., & Sethi, S. A. (2020).
Multimodal travel behaviour, walkability indices, and social mobility: How
neighbourhood walkability, income and household characteristics guide walking,
biking & transit decisions. Local Environment, 25(1), 57–68.
Rockhill, S. M., Soto, G. W., Whitfield,
G. P., Barry, V., & Fletcher, K. (2025). Associations between National
walkability Index and Traffic-Related pedestrian Deaths, United States,
2017–2019. Transportation Research Interdisciplinary Perspectives, 31,
101404. https://doi.org/10.1016/j.trip.2025.101404
Rohrer, J., Pierce, J., & Denison, A.
(2004). Walkability and self-rated health in primary care patients. BMC
Family Practice, 5(1), 29. https://doi.org/10.1186/1471-2296-5-29
Sallis, J. F., Floyd, M. F., Rodríguez, D.
A., & Saelens, B. E. (2012). Role of built environments in physical
activity, obesity, and cardiovascular disease. Circulation, 125(5),
729–737.
Salvo, G., Lashewicz, B. M., Doyle-Baker,
P. K., & McCormack, G. R. (2018). Neighbourhood built environment
influences on physical activity among adults: A systematized review of
qualitative evidence. International Journal of Environmental Research and
Public Health, 15(5), 897.
Shediac-Rizkallah, M. C., & Bone, L.
R. (1998). Planning for the sustainability of community-based health programs:
Conceptual frameworks and future directions for research, practice and policy. Health
Education Research, 13(1), 87–108.
Sher, Y., Lolak, S., & Maldonado, J.
R. (2010). The Impact of Depression in Heart Disease. Current Psychiatry
Reports, 12(3), 255–264. https://doi.org/10.1007/s11920-010-0116-8
Smith, K. R., Brown, B. B., Yamada, I.,
Kowaleski-Jones, L., Zick, C. D., & Fan, J. X. (2008). Walkability and body
mass index: Density, design, and new diversity measures. American Journal of
Preventive Medicine, 35(3), 237–244.
Sonawane, K., Borse, K. N., Jefferson, M.,
Damgacioglu, H., Carpenter, M. J., Pearce, J. L., Ogretmen, B., Paczesny, S.,
O’Bryan, J. P., Obeid, J. S., Ford, M. E., & Deshmukh, A. A. (2024).
Developing catchment area data dashboards for cancer centers: A
stakeholder-engaged approach. Preventive Oncology & Epidemiology, 2(1),
2394193. https://doi.org/10.1080/28322134.2024.2394193
South Carolina Department of Public
Health. (2024). South Carolina Department of Public Health.
https://dph.sc.gov/professionals/public-health-data/behavioral-risk-factor-surveillance-system-brfss
StataCorp. (2023). Stata Statistical
Software: Release 18. College Station, TX: StataCorp LLC. [Computer
software].
https://www.stata.com/support/faqs/resources/citing-software-documentation-faqs/
Stowe, E. W., Hughey, S. M., Hallum, S.
H., & Kaczynski, A. T. (2019). Associations between walkability and youth
obesity: Differences by urbanicity. Childhood Obesity, 15(8),
555–559.
Tao, Y., Ma, J., Shen, Y., & Chai, Y.
(2022). Neighborhood effects on health: A multilevel analysis of neighborhood
environment, physical activity and public health in suburban Shanghai. Cities,
129, 103847.
Thielman, J., Rosella, L., Copes, R.,
Lebenbaum, M., & Manson, H. (2015). Neighborhood walkability: Differential
associations with self-reported transport walking and leisure-time physical
activity in Canadian towns and cities of all sizes. Preventive Medicine,
77, 174–180. https://doi.org/10.1016/j.ypmed.2015.05.011
Thomas, J., & Zeller, L. (2017).
National walkability index user guide and methodology. Environ. Prot.
Agency: Washington, DC, USA.
Thomas, K. M., Hesam Shariati, F., Hallum,
S. H., & Kaczynski, A. T. (2025). Examining the Relationship Between Social
Vulnerability and Sidewalk Access and Walkability Across a Large Southeastern
U.S. City. Environmental Justice, 19394071251378221.
https://doi.org/10.1177/19394071251378221
Twenge, J. M., Cooper, A. B., Joiner, T.
E., Duffy, M. E., & Binau, S. G. (2019). Age, period, and cohort trends in
mood disorder indicators and suicide-related outcomes in a nationally
representative dataset, 2005–2017. Journal of Abnormal Psychology, 128(3),
185.
US Census Bureau, South Carolina. (2020). US
Census Bureau QuickFacts: South Carolina.
https://www.census.gov/quickfacts/fact/table/SC/POP060220#POP060220
U.S. Department of Agriculture, Economic
Research Service. (2025). U.S. Department of Agriculture, Economic Research
Service. 2020 Rural-Urban Commuting Area Codes.
https://www.ers.usda.gov/data-products/rural-urban-commuting-area-codes
US Department of Agriculture, Economic
Research Service [USDA ERS]. (2024). USDA, ERS.
https://www.ers.usda.gov/data-products/rural-urban-commuting-area-codes/documentation/
US EPA, O. (2021, May 17). National
Walkability Index User Guide and Methodology [Reports and Assessments].
https://www.epa.gov/smartgrowth/national-walkability-index-user-guide-and-methodology
Van Cauwenberg, J., Van Holle, V., De
Bourdeaudhuij, I., Van Dyck, D., & Deforche, B. (2016). Neighborhood
walkability and health outcomes among older adults: The mediating role of
physical activity. Health & Place, 37, 16–25.
https://doi.org/10.1016/j.healthplace.2015.11.003
Van Holle, V., Van Cauwenberg, J., Van
Dyck, D., Deforche, B., Van de Weghe, N., & De Bourdeaudhuij, I. (2014).
Relationship between neighborhood walkability and older adults’ physical
activity: Results from the Belgian Environmental Physical Activity Study in
Seniors (BEPAS Seniors). International Journal of Behavioral Nutrition and
Physical Activity, 11, 1–9.
Wali, B. (2023). Interactive impacts of
walkability, social vulnerability, & travel behavior on COVID-19 mortality:
A hierarchical Bayesian spatial random parameter approach. Sustainable
Cities and Society, 91, 104454.
Wang, M. L., Narcisse, M., & McElfish,
P. A. (2023). Higher walkability associated with increased physical activity
and reduced obesity among United States adults. Obesity, 31(2),
553–564. https://doi.org/10.1002/oby.23634
Watson, K. B., Whitfield, G. P., Thomas,
J. V., Berrigan, D., Fulton, J. E., & Carlson, S. A. (2020). Associations
between the national walkability index and walking among US adults—National
Health Interview Survey, 2015. Preventive Medicine, 137, 106122.
Wei, Y. D., Xiao, W., Wen, M., & Wei,
R. (2016). Walkability, land use and physical activity. Sustainability, 8(1),
65.
Westenhöfer, J., Nouri, E., Reschke, M.
L., Seebach, F., & Buchcik, J. (2023). Walkability and urban built
environments—A systematic review of health impact assessments (HIA). BMC
Public Health, 23(1), 1–19.
White, M. J., McClure, E., Killeen, J.,
Howard, J., Skinner, A. C., Spears, T., & Perrin, E. M. (2021). Changes in
the recreational built environment and youth body mass index. Academic
Pediatrics, 21(1), 76–83.
Willey, J. Z., Moon, Y. P., Sacco, R. L.,
Greenlee, H., Diaz, K. M., Wright, C. B., Elkind, M. S., & Cheung, Y. K.
(2017). Physical inactivity is a strong risk factor for stroke in the oldest
old: Findings from a multi-ethnic population (the Northern Manhattan Study). International
Journal of Stroke, 12(2), 197–200.
https://doi.org/10.1177/1747493016676614
Williams, T., Lakhani, A., & Spelten,
E. (2022). Interventions to reduce loneliness and social isolation in rural
settings: A mixed-methods review. Journal of Rural Studies, 90,
76–92.
Yoon, H., Choi, K., & Jang, Y. (2017).
The Role of Neighborhood Walkable Design and Walking Behavior in Mental Health
(poster). Journal of Transport & Health, 7, S9.
Zhu, X., Lu, Z., Yu, C.-Y., Lee, C., &
Mann, G. (2013). Walkable communities: Impacts on residents’ physical and
social health. World Health Design, 6(3), 68–75.