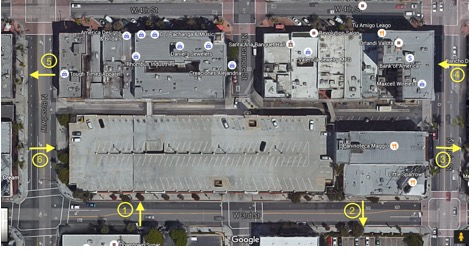
Figure 1: Map depicting target areas (numbers in yellow circles) and direction of observation (Google, 2015)
Assessing the Impact of Sharrows on Bicyclist Behavior: A three-year natural experiment in Santa Ana, California
Mojgan Sami1, Soultana Macridis2, Deepak Sharma3, and Oladele Ogunseitan4
1Department of Public Health, College of Health & Human Development, California State University Fullerton, U.S.A.
2Centre for Active Living, University of Alberta, Canada
3Department of Civil and Environmental Engineering, California State University Fullerton, U.S.A.
4Joe C. Wen School of Population & Public Health, University of California, U.S.A.
Abstract
Bicycle infrastructure preferences vary by rider experience and comfort, yet both bicyclists and motorists perceive separated bicycle lanes as safer than shared lane markings (sharrows). Despite widespread adoption, evidence on the real-world behavioral impacts of sharrows remains limited. This study evaluates a natural experiment in Santa Ana, California, where sharrows were installed in a downtown commercial corridor when separated bicycle lanes were not feasible. Researchers collected baseline data in September 2015 and follow-up data in February 2016 and early 2017, totaling 54 hours of direct bicycle observation across two target areas.
Results revealed a mixed and cautionary pattern of change. West-to-East mean bicycle counts increased significantly from 0.986 (2015) to 1.734 (2016; p = 0.045) but declined to 1.500 by 2017. East-to-West counts showed modest, non-significant year-over-year growth. Critically, sidewalk riding increased significantly from 2015 to 2016 (p = 0.002) and remained elevated through 2017 (p = 0.009), and wrong-way riding increased significantly from 2015 to 2016 (p = 0.003). Female ridership declined from 2015 to 2016 (p = 0.036) but recovered by 2017. Ridership among adults over 65 declined post-installation without meaningful recovery.
Overall, sharrow installation was not associated with lasting ridership gains or improved safe bicycling behavior. Declines among women and older adults suggest sharrows may not adequately meet the needs of all roadway users. Drawing on the present data and prior literature, policymakers should consider pairing sharrows with education programs, driver awareness campaigns, and enhanced infrastructure to support safety, equity, and sustained bicycling engagement.
Keywords: sharrow, shared lane markings, bicycling, active transportation
Physical inactivity is a well-established risk factor for chronic health conditions, such as hypertension, obesity, cancer, type 2 diabetes, and cardiovascular disease (Bourke et al., 2024). While health promotion and education are crucial for encouraging physical activity, infrastructural barriers exacerbated by car-centric road designs and policies often discourage active modes of travel such as walking, bicycling, and skateboarding (Hoyer-Kruse et al., 2024). According to the World Health Organization (WHO), physical inactivity could cost US$27 billion annually between 2020-2030 if barriers to active lifestyles are not addressed (World Health Organization, 2022). The WHO and the Centers for Disease Control and Prevention (CDC) recognize the critical role the built environment plays in enabling or hindering physical activity, and recommend governments invest in built environment improvements to support active transportation as a means to reduce chronic disease burdens (Centers for Disease Control and Prevention, 2023; World Health Organization, 2025).
Active transportation is increasingly recommended to promote healthier lifestyles. However, traditional street designs in Southern California often lack features that encourage bicycling or walking over personal vehicle use (De Nazelle et al., 2011). Essential characteristics include separated or buffered bike lanes, connectivity of bike paths, traffic-calming techniques, and slower traffic speeds (Winters et al., 2012). Cities with well-developed bicycle infrastructure report higher numbers of bicyclists per capita compared to those with inadequate facilities (Dill & Carr, 2003; Ferenchak & Marshall, 2016; Wegman et al., 2012). Separated bike lanes also improve compliance with traffic rules (e.g., riding in the correct direction, not riding on sidewalks) and enhance safety perceptions among bicyclists and pedestrians (Buehler & Dill, 2015). In addition, a recent systematic review shows that physical activity levels increase when cyclists have access to safe infrastructure, underscoring the importance of dedicated bicycle facilities for population-level health (Zukowska et al., 2022).
Despite the growing body of evidence supporting infrastructure-based strategies for active transportation, local governments often face political, financial, technical, and regulatory barriers that hinder the implementation of bicycle lanes (Ferenchak & Marshall, 2016; Lawson et al., 2012; Monsere et al., 2012; Wegman et al., 2012; Winters et al., 2012). In some cases, roads may be too narrow for separated lanes (Ferenchak & Marshall, 2016; Schneider, 2013). As an alternative, cities implement shared road signage and traffic-calming techniques to decrease automobile speeds and remind drivers to share the road with bicycles without requiring major structural redesign (Ferenchak & Marshall, 2016; Ferenchak & Marshall, 2019). Although sharrows are not the preferred choice among active transportation advocates, due to the lack of physical separation from vehicles (Buehler & Dill, 2015; Speck, 2018), they are frequently utilized in urban environments where right-of-way, roadway width, or funding constraints limit the feasibility of separated facilities and require retrofit treatments within the existing built environment (Ferenchak & Marshall, 2019; Goddard, 2017; Hess & Peterson, 2015).
Evidence regarding the effectiveness of sharrows in promoting bicycling behavior and improving safety are mixed (Ferenchak & Marshall, 2016; Ferenchak & Marshall, 2019; Fitch-Polse & Agarwal, 2025). Although sharrows may improve motorist awareness and bicyclist positioning in some contexts, current evidence does not demonstrate consistent safety benefits comparable to protected or dedicated bicycle facilities. For instance, signs reading “Bicycles May Use Full Lane” are often preferred over “Share the Road” signs (Hess & Peterson, 2015). Data on the impact of sharrows on collision prevention and ridership are also inconsistent (Ferenchak & Marshall, 2016; Fitch-Polse & Agarwal, 2025). For example, while Los Angeles reported mixed results using sharrows to improve bicycle safety, Long Beach saw increased ridership and decreased collisions when sharrows were part of a broader active transportation plan (Schneider, 2013). Since the Long Beach initiative included multiple infrastructure and programmatic components, the independent effect of sharrows could not be isolated.
Transportation planners often evaluate sharrows by documenting road use and bicyclist positioning, however existing research has not provided definitive conclusions on their efficacy (Vasilev et al., 2017). To date, no peer-reviewed studies have investigated pre- and post-implementation changes in bicycling behavior associated with sharrows. In addition to overall bicycling volumes, this study also examined wrong-way riding and sidewalk riding, behaviors that serve as important indicators for perceptions of bicyclist safety and traffic regulation compliance, as they reflect how roadway design influences rider choices. Including these behaviors provides a more comprehensive understanding of bicyclist activity in the study area pre and post sharrow installation.
This study addresses gaps in research of the impacts of sharrows by evaluating changes in bicycling behavior following the installation of shared road signage in Santa Ana, California, through a natural experiment conducted between 2015 and 2017. While the data reflect a past period, they capture a pivotal moment when the city was actively exploring infrastructure strategies to promote physical activity. The findings offer a valuable historical perspective on Santa Ana’s transportation planning efforts and provide a foundation for understanding how past interventions can inform current and future practices. As the built environment continues to evolve, this research highlights the need for ongoing evaluation to assess how infrastructure changes influence bicycling behavior and pedestrian safety. These insights may be particularly relevant for urban planners and public health practitioners working in communities with similar demographic characteristics and built environment constraints.
Methods
Setting and Site Selection
Santa Ana, located in central Orange County (OC), California, experiences significant health disparities despite the county's overall affluence. Obesity in OC is driven by environmental and social factors, particularly the lack of safe, accessible green spaces in predominantly Hispanic neighborhoods. Although many residents recognize the importance of physical activity, limited recreational infrastructure continues to restrict opportunities for exercise, reinforcing health disparities (Healthy Places by Design., n.d.). Nearly 33% of elementary school children in Santa Ana are considered obese, compared to 18% across Orange County (Orange County Health Care Agency, 2024). The city’s population is predominantly Hispanic/Latino/a/x (77%) and obesity rates reflect racial and ethnic disparities (U.S. Census Bureau, 2024). Among Hispanic adults in Santa Ana, 36.1% are classified as obese, compared to 24.5% in the neighboring city of Irvine (Centers for Disease Control and Prevention, 2024). Obesity rates also vary across racial groups with 29.7% among non-Hispanic White adults, 34.7% among Black adults, and 11.6% among Asian adults (Centers for Disease Control and Prevention, 2024). Additionally, obesity prevalence is slightly higher among women (28.7%) than men (27.6%) (University of Wisconsin Population Health Institute, 2024).
These disparities underscore the importance of targeted public health interventions and built infrastructure improvements to promote physical activity and reduce obesity in Santa Ana's diverse neighborhoods. In car-centric cities like Santa Ana, limited walkability, urban sprawl and lack of green/recreational spaces can create barriers for an active lifestyle, especially in children, elders, and women. In response, the city has pursued policy and infrastructure changes over the past two decades (Fortin, 2017). For example, Latino Health Access (LHA), a local non-profit, established a three-square-mile “Wellness Corridor” in downtown Santa Ana to encourage physical activity through infrastructure and messaging, while Santa Ana Active Streets (SAAS) has engaged residents through bike safety training and community advocacy in culturally and linguistically adaptive ways to the Hispanic community throughout central OC (Latino Health Access, 2018; Santa Ana Active Streets Coalition, 2024). The sharrow implementation evaluated in this study is one component of these broader efforts to improve health through changes to the built environment. By documenting bicycling behavior before and after this specific intervention, the study contributes timely, practice-oriented evidence for cities considering similar low-cost strategies to increase active transportation.
This project evaluated bicycle and pedestrian behavior in 2015, prior to implementation, and in 2016 and 2017, after implementation of sharrows along West Third Street in central Santa Ana, California, which was part of the city’s Wellness Corridor. This design allowed for the ability to isolate and assess changes in bicycle ridership patterns over a sustained period. The intervention aimed to encourage safe, on-street bicycling behavior in a densely populated downtown commercial corridor. Although sharrow installation was a part of Santa Ana’s broader Active Transportation plan, no concurrent education, outreach, or enforcement activities targeted bicyclists or drivers and were beyond the scope of this study.
In partnership with Santa Ana’s Active Transportation Coordinator, researchers selected observation sites along the sharrow-designated street to assess pre- and post-intervention bicycle use. Initially, six target areas were proposed, but pilot testing and safety considerations led to the final selection of two mid-block locations approximately one block apart: Target Area 1 (TA-1) and Target Area 2 (TA-2; See Figure 1). Observational site selection accounted for safety, visibility, and expected rider volume, balancing research goals with implementation constraints typical in real-world urban transportation projects. For example, locations with numerous business entryways and service access points were excluded due to challenges in maintaining consistent observer positioning and minimizing interruptions to data collection. Several street segments also served as busy pedestrian pathways, where researchers’ presence risked disrupting foot traffic. In other areas, sidewalk obstacles such as utility infrastructure, street furniture, and encroachments reduced sightlines and would have forced observers to adjust positions in proximity to moving vehicles or pedestrians, presenting safety risks and potential threats to data reliability.
Figure 1: Map depicting target areas (numbers in yellow circles) and direction of observation (Google, 2015)
Instrument and Observation Schedule
To systematically observe behavioral patterns, trained observers used a standardized data collection instrument from the Bike Count Data Clearinghouse (BCDC), maintained by the UCLA Luskin School of Public Affairs (University of California, n.d.). This form, widely used by transportation agencies in Southern California, captures counts and observable characteristics of bicyclists and pedestrians in designated locations. Key variables include contextual factors (e.g., date, time, and weather conditions), bicycle volume and direction of travel, rider characteristics (e.g., observer-defined gender and age group), and riding behaviors (e.g., sidewalk riding, wrong-way riding, and helmet use).
In this study, “observed gender” and “observed age” refer to the gender presentation and age group perceived and recorded by researchers based on visual or contextual cues during data collection. These categorizations do not reflect individuals’ self-identified gender, sex, or exact age and were used solely to support observational consistency in the absence of self-reported data, with recognition of the limitations inherent in observational inference (Sami et al., 2025). In other words, observed gender and age characteristics were included to examine whether ridership changes differed across groups historically less represented in bicycling. However, we recognize that gender estimation in observational research is inherently limited, as it reflects perceived presentation rather than self-identified gender. Accordingly, these data are used to identify broad participation patterns rather than to make claims about gendered behavior (Hansmann et al., 2022; Mogaji & Uzondu, 2022; Yuan et al., 2023). Prior to data collection, observers completed standardized training to ensure consistent application of variable definitions and inter-rater reliability of rider characteristics.
Data collection occurred at both target areas on three days within a single week – Monday, Wednesday, and Saturday – across three consistent time intervals: morning (7:30–9:30 am), midday (11:30 am–1:30 pm), and afternoon (3:30–5:30 pm). Pre-intervention observations were conducted in September 2015, with post-intervention observations completed in February 2016 and again in early 2017. Two post-intervention data collection periods were intentionally included to assess both immediate and longer-term changes in bicycle ridership following sharrow installation. While the 2016 follow-up captured short-term responses to the intervention, the 2017 follow-up allowed examination of whether observed changes were sustained or shifted over time. A total of 54 hours of observations were completed across the study period.
Data Analysis
This evaluation’s analysis focused on whether the installation of sharrows influenced bicyclist behavior and usage of the corridor. The primary outcome was the number of bicyclists using the sharrow (rather than the sidewalk), traveling in the correct direction of traffic (rather than wrong-way riding or cycling against the designated traffic direction), and aligned with a key behavioral goal of the intervention. Each behavior was counted separately for every observation period. These measures were included to capture safety- and compliance-related behaviors that may be influenced by infrastructure, traffic conditions, or route familiarity.
To promote consistency and reduce observational bias, field staff underwent training and completed inter-rater reliability checks at both sites. In addition, observational studies rely on observers’ interpretations of demographic characteristics, which can present reliability challenges (Marquet et al., 2019). Observers recorded demographic characteristics such as apparent gender and age, acknowledging limitations inherent in visual estimation. What is referred to here as “sex” is more accurately described as “observed gender presentation,” which aligns with the UCLA BCDC observation tool terminology (University of California, n.d.).
To assess the impact of the intervention, pre- and post-installation annual mean bicycle counts, at TA-1 and TA-2 were compared using independent-samples t-tests. Based on the expected increase in bicycle usage following the installation of sharrows, one-tailed hypothesis tests were conducted:
When the assumption of equal variances held, a pooled-variance t-test was used – a robust test to moderate departures from normality, especially with larger sample sizes (Levine et al., 2016). To determine whether the equal variance assumption was appropriate, F-tests were conducted to compare the variances of pre- and post-intervention samples. In cases where variances differed significantly (F-statistic > F-critical value; p < 0.05), separate-variance t-tests were applied.
Results
As reported in Table 1, in TA-1 (see Figure 1), there was a significant increase in the West to East (WE) direction in the mean bicycle count from 2015 (0.986) to 2016 (1.734), followed by a slight decrease in 2017 (1.500). The East to West (EW) mean bicycle count showed a slight increase each year, indicating a gradual rise in bicycle traffic in the EW direction. Further, the mean bicycle count for females was low in 2015 and 2016, with a noticeable increase in 2017. The mean bicycle count for individuals over 65 years of age decreases from 2015 to 2016 and slightly increases in 2017. Finally, a significant increase in wrong-way riding from 2015 to 2016 was observed, but this decreased in 2017.
Table 1: Descriptive Statistics of Each Target Area
|
|
Target Area 1 |
Target Area 2 |
||||||
|
Bike Count Criteria |
Year |
n= |
Mean |
Variance |
Year |
n= |
Mean |
Variance |
|
EW Direction |
2015 |
72 |
1.167 |
1.887 |
2015 |
80 |
1.513 |
2.506 |
|
|
2016 |
48 |
1.208 |
1.871 |
2016 |
48 |
1.188 |
1.177 |
|
|
2017 |
72 |
1.264 |
1.915 |
2017 |
72 |
1.472 |
1.633 |
|
WE Direction |
2015 |
72 |
0.986 |
1.620 |
2015 |
80 |
1.013 |
1.228 |
|
|
2016 |
48 |
1.734 |
1.734 |
2016 |
48 |
1.167 |
1.504 |
|
|
2017 |
72 |
1.500 |
1.465 |
2017 |
72 |
1.486 |
1.577 |
|
Females |
2015 |
72 |
0.208 |
0.224 |
2015 |
80 |
0.313 |
0.395 |
|
|
2016 |
48 |
0.083 |
0.078 |
2016 |
48 |
0.125 |
0.112 |
|
|
2017 |
72 |
0.375 |
0.379 |
2017 |
72 |
0.542 |
0.505 |
|
Over 65 years of age |
2015 |
72 |
0.319 |
0.277 |
2015 |
80 |
0.15 |
0.154 |
|
|
2016 |
48 |
0.146 |
0.170 |
2016 |
48 |
0.021 |
0.021 |
|
|
2017 |
72 |
0.181 |
0.235 |
2017 |
72 |
0.153 |
0.244 |
|
Sidewalk |
2015 |
72 |
0.639 |
0.713 |
2015 |
80 |
0.963 |
1.050 |
|
|
2016 |
48 |
1.25 |
1.511 |
2016 |
48 |
1.083 |
1.567 |
|
|
2017 |
72 |
1.11 |
2.100 |
2017 |
72 |
1.264 |
1.831 |
|
Wrong way |
2015 |
72 |
0.444 |
0.504 |
2015 |
80 |
0.838 |
0.923 |
|
|
2016 |
48 |
1.020 |
2.276 |
2016 |
48 |
0.625 |
0.835 |
|
|
2017 |
72 |
0.569 |
0.756 |
2017 |
72 |
0.667 |
1.155 |
Results of bicycle count data analysis (Table 2), show that sharrows increased the bicyclist count from 2015 to 2016 in the West to East direction in TA-1. The increase of means of bicycle count of 0.748 (calculated as 1.734 from 2016 minus 0.986 from 2015) is found to be significant (p = 0.045). A significant increase was observed between the means of 2015 (pre-intervention) and 2017 (p = 0.007) and means of 2015 and combined post-intervention 2016 and 2017 (p = 0.006). Although bicycle counts decreased from 2016 to 2017, it was not significant (p = 0.329). In the EW direction the means increased year-over-year but were statistically insignificant (Table 2). Mean of bicycle count of Females decreased from 2015 to 2016 (p = 0.036) but increased significantly from 2016 to 2017 (p = 0.000). Among those over 65 years of age, the mean of bicycle count decreased from 2015 to 2016 (p = 0.028) and from 2015 to 2017 remained low (p = 0.051).
Table 2: Bike Count Data Analysis for Target Area-1
|
Criteria |
Comparison Times |
Difference in Means |
F test (F | df1, df2 | p-value) |
t-test (p-values, for equal variance) |
t-test (p-values, unequal variance) |
|
EW Direction |
2015-2016 |
0.041 |
1.00 | 71, 47 | 0.494 |
0.435 |
|
|
|
2015-2016 & 2017 |
0.075 |
1.10 | 71, 59 | 0.350 |
0.357 |
|
|
|
2015-2017 |
0.097 |
0.99 | 71, 71 | 0.475 |
0.336 |
|
|
|
2016-2017 |
0.056 |
0.98 | 47, 71 | 0.472 |
0.414 |
|
|
WE Direction |
2015-2016 |
0.748 |
0.93 | 71, 47 | 0.392 |
0.045** |
|
|
|
2015-2016 & 2017 |
0.472 |
1.04 | 71, 59 |0.425 |
0.006*** |
|
|
|
2015-2017 |
0.514 |
1.11 | 71, 71 | 0.337 |
0.007*** |
|
|
|
2016-2017 |
-0.234 |
1.18 | 47, 71 | 0.257 |
0.329 |
|
|
Females |
2015-2016 |
-0.125 |
2.87 | 71, 47 | 0.000*** |
|
0.036** |
|
|
2015-2016 & 2017 |
0.050 |
0.81 | 71, 59 | 0.163 |
0.255 |
|
|
|
2015-2017 |
0.167 |
0.59 | 71, 71 |0.014** |
0.035** |
|
|
|
2016-2017 |
0.292 |
0.21 | 47, 71 | 0.000*** |
0.001*** |
|
|
Over 65 years of age |
2015-2016 |
-0.173 |
1.63 | 71, 47 |0.038* |
|
0.028** |
|
|
2015-2016 & 2017 |
-0.152 |
1.34 | 71, 59 | 0.082 |
0.018** |
|
|
|
2015-2017 |
-0.138 |
1.18 | 71, 71 | 0.244 |
0.051* |
|
|
|
2016-2017 |
0.035 |
0.72 | 47, 71 |0.120 |
0.342 |
|
|
Sidewalk |
2015-2016 |
0.611 |
0.47 | 71, 47 | 0.002*** |
0.001*** |
|
|
|
2015-2016 & 2017 |
0.528 |
0.38 | 71, 59 | 0.000*** |
0.002*** |
|
|
|
2015-2017 |
0.471 |
0.34 | 71, 71 | 0.000*** |
0.009*** |
|
|
|
2016-2017 |
-0.14 |
0.72 | 47, 71 | 0.115 |
0.293 |
|
|
Wrong way |
2015-2016 |
0.576 |
0.22 | 71, 47 | 0.000*** |
0.003*** |
|
|
|
2015-2016 & 2017 |
0.306 |
0.36 | 71, 59 | 0.000*** |
0.024** |
|
|
|
2015-2017 |
0.125 |
0.66 | 71, 71 | 0.045* |
0.173 |
|
|
|
2016-2017 |
-0.451 |
3.01 | 47, 71 | 0.000*** |
|
0.033** |
|
*** p < 0.01, ** p < 0.05, * p < 0.10; All p values reported in this table are one tail values |
|||||
For the sidewalk bicycle count means, there was significant increase from 2015 to 2016 (p = 0.002) and then 2015 to 2017 (p = 0.009). Lastly, data from TA-1 also reveals a significant increase in wrong way bicycling from 2015 to 2016 (p = 0.003). Comparing the bicycle count data between 2015 and 2017 the difference was not statistically significant (p = 0.173). Interestingly, wrong way bicycle counts decreased from 2016 to 2017 (p = 0.033).
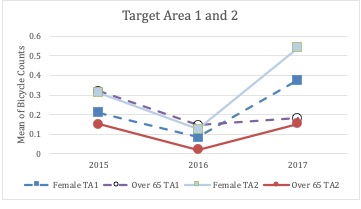
Bicycle data from TA-2 showed some similarity to TA-1, but with distinct differences. The main similarity observed was the positive differences between the mean of bicycle counts (Table 1). The positive difference in Tables 2 and 3 indicate that in majority of cases the bicycling activity increased from 2015 through 2017. The mean of bicycle counts increased for WE direction, but no statistical difference from the EW direction were found. This pattern remained similar in both, TA-1 and TA-2. Additionally, the mean of bicycle counts of Females and those over 65 years of age reduced from 2015 to 2016 as depicted in Figure 2.
While the mean of female bikers increased significantly from 2016 to 2017 for both target areas (p=0.000 in Tables 2 and 3), the means of bicyclists over 65 years of age did not increase in a similar way. For TA-2 the increase in mean of bicyclists over 65 years of age was evident from the p-value of 0.017 (Table 3), but for TA1 the increase was statistically indifferent (Table 2). The Sidewalk and Wrong way riding count means were statistically indifferent for TA2, except for 2015 vs 2016 and 2017 combined (Table 3), but were significantly different for TA-1 (Table 2).
Table 3: Bike Count Data Analysis for Target Area-2
|
Criteria |
Comparison Times |
Difference in Means |
F test (F Stat | df1, df2 | p-value) |
t-test (p-values, for equal variance) |
t-test (p-values, unequal variance) |
|
EW Direction |
2015-2016 |
-0.325 |
2.13 | 79, 47 | 0.003*** |
|
0.090 |
|
|
2015-2016 & 2017 |
1.147 |
1.72 | 79, 119 | 0.004*** |
|
0.231 |
|
|
2015-2017 |
-0.041 |
1.53 | 79, 71 | 0.034* |
0.432 |
|
|
|
2016-2017 |
0.284 |
0.72 | 119, 71 | 0.117 |
0.104 |
|
|
WE Direction |
2015-2016 |
0.154 |
0.82 | 79, 47 | 0.220 |
0.233 |
|
|
|
2015-2016 & 2017 |
1.64 |
0.78 | 79, 119 | 0.127 |
0.023** |
|
|
|
2015-2017 |
0.473 |
0.78 | 79, 71 | 0.139 |
0.007*** |
|
|
|
2016-2017 |
0.319 |
0.95 | 119, 71 | 0.436 |
0.085* |
|
|
Females |
2015-2016 |
-0.188 |
3.53 | 79, 47 | 0.000*** |
|
0.015** |
|
|
2015-2016 & 2017 |
0.354 |
1.01 | 79, 119 | 0.460 |
0.244 |
|
|
|
2015-2017 |
0.229 |
0.78 | 79, 71 | 0.143 |
0.018** |
|
|
|
2016-2017 |
0.417 |
0.22 | 119, 71 | 0.000*** |
|
0.000*** |
|
Over 65 years of age |
2015-2016 |
-0.129 |
7.41 | 79, 47 | 0.000*** |
|
0.005*** |
|
|
2015-2016 & 2017 |
0.024 |
0.98 | 79, 119 | 0.462 |
0.191 |
|
|
|
2015-2017 |
0.003 |
0.63 | 79, 71 | 0.024** |
|
0.485 |
|
|
2016-2017 |
0.132 |
0.09 | 119, 71 | 0.000*** |
|
0.017** |
|
Sidewalk |
2015-2016 |
0.12 |
0.67 | 79, 47 | 0.057 |
0.277 |
|
|
|
2015-2016 & 2017 |
1.384 |
0.61 | 79, 119 | 0.009** |
|
0.085 |
|
|
2015-2017 |
0.301 |
0.57 | 79, 71 | 0.008** |
|
0.064 |
|
|
2016-2017 |
0.181 |
0.86 | 119, 71 | 0.288 |
0.231 |
|
|
Wrong way |
2015-2016 |
-0.213 |
1.10 | 79, 47 | 0.360 |
0.110 |
|
|
|
2015-2016 & 2017 |
0.454 |
0.91 | 79, 119 | 0.320 |
0.096* |
|
|
|
2015-2017 |
-0.171 |
0.80 | 79, 71 | 0.165 |
0.151 |
|
|
|
2016-2017 |
0.042 |
0.72 | 119, 71 | 0.120 |
0.413 |
|
|
*** p < 0.01, ** p < 0.05, * p < 0.10; All p values reported in this table are one tail values |
|||||
Figure 2: Women and Over 65 Riders in TA-1 and TA-2
Discussion
This study is the first to employ a natural experiment with a three-year pre-post observational design to assess the isolated effects of shared lane markings (sharrows) on bicyclist behavior in Santa Ana, California. Direct observations at two sites revealed a small increase in bicycling following sharrow installation between 2015 and 2016 but was not sustained into 2017. Additionally, increases in sidewalk and wrong-way riding over time were observed, along with a decline in ridership among women and adults over 65 years of age.
In this study, directional ridership patterns differed by travel direction following installation, with west-to-east (WE) trips showing a sharper immediate increase that later tapered slightly, while east-to-west (EW) trips exhibited more gradual and sustained growth over time. Although this study was not designed to identify causal mechanisms behind these directional differences, the observed patterns suggest that responses to sharrow installation may vary depending on corridor dynamics and travel context, including factors such as destination-oriented travel, availability of bicycle parking, broader connectivity, and daily commuting flows. The short-term surge in WE ridership may reflect initial awareness or novelty effects after installation, whereas the steadier increase in EW travel may indicate a slower normalization of bicycling behavior. Overall, these findings highlight that the impacts of shared lane markings are not necessarily uniform across directions of travel and underscore the importance of directional analysis in capturing more nuanced, context-specific responses to active transportation interventions (Dey et al., 2018; Wen et al., 2025).
Although not explicitly measured in this study, these study findings align with prior research showing that perceptions of safety are a critical factor in decisions to engage in active transportation, especially among adults over 65 years of age (Mertens et al., 2019; Sanders, 2015), and thus, sharrows may not be sufficient to support long-term increases in bicycling or improve safe riding behaviors. Infrastructure that separates bicycles from motor vehicle traffic, such as protected bicycle lanes and traffic-/speed-calmed streets, have shown to improve both perceived and actual safety (Buehler & Dill, 2015; Dill & Carr, 2003; Lawson et al., 2012; Monsere et al., 2012; Wegman et al., 2012). Further, emerging research suggests cultural world views may influence bicycling across different infrastructure types (Noland et al., 2023).
From a policy and planning perspective, these findings underscore the need to evaluate real-world effectiveness of low-cost infrastructure like sharrows. Although budget-friendly, sharrows may not fully meet the safety and accessibility needs for all users and could unintentionally encourage unsafe behavior, particularly among less experienced cyclists. To maximize their effectiveness, local governments and transportation departments should consider pairing sharrows with complementary strategies. These may include targeted bicyclist education programs, driver awareness campaigns, or improvements to nearby infrastructure that enhance visibility and predictability of cyclist movements. By combining sharrows with such supportive measures, municipalities can promote safer, more equitable road environments and encourage sustained engagement in bicycling, ensuring that the benefits of low-cost interventions are realized without compromising user safety.
As a pre-post observational study conducted between 2015 and 2017, this research is limited in its ability to produce generalizable conclusions. The age of the data and the constraints of observational design, such as the absence of a control group, limit causal inference. In addition, as a multi-partner project with local agencies and organizations, this study required extensive coordination for field data collection including, scheduling with the Santa Ana planning staff, aligning with procurement and construction calendars, and securing permission from local businesses to use observation sites (standing in front of their establishments). Although the collaborative nature of the project improved stakeholder engagement, it also introduced operational variability and constrained control over external influences.
One logistical constraint was the inability to collect pre- and post-intervention data during the same months across years. Although Santa Ana’s mild climate reduces the likelihood of seasonal effects, the lack of alignment in data collection timing remains a methodological limitation. While season and weather-related variation may influence bicycling behavior, these factors were not explicitly modeled in the present analysis and are important factors to incorporate in future research. Similarly, although the study initially identified six observation areas, only two were ultimately used. This decision prioritized data integrity ensured adequate staffing in the field and addressed issues with missing or inconsistent data caused by limited inter-rater reliability. Nevertheless, the large set of observations collected for the two target areas over three time periods is sufficient for robust data analysis and interpretation.
Another limitation stems from our use of the UCLA Luskin School of Public Affairs’ comprehensive research tool for aggregating bicycle ridership data and pedestrian data in Southern California (University of California, n.d.). However, this database does not allow for the immediate recovery and analysis of pedestrian data, and final datasets are made available to researchers only in an aggregated format. In fact, our team noted that the database is no longer publicly available and are unable to access our original data for further analysis. As such, it is difficult to compare our study’s data with data for other interventions in the region.
Finally, this study relied primarily on observations of bicycling behavior before and after implementation of sharrows and did not account for bicyclist, pedestrian, or driver preferences, such as the desire for separated or buffered bike lanes, traffic-calming techniques, or slower traffic speeds to list a few. Recognizing the growing body of evidence supporting infrastructure-based strategies combined with the varying constraints, such as political, financial, technical, and spatial that influence bicycle infrastructure decisions, this study could be strengthened by understanding user perceptions and preferences (Ferenchak & Marshall, 2016; Lawson et al., 2012; Monsere et al., 2012; Schneider, 2013; Wegman et al., 2012; Winters et al., 2012). Incorporating these perspectives through methods such as surveys, focus groups, or community engagement sessions, would provide a more comprehensive understanding of how infrastructure interventions align with the needs and expectations of all users.
Despite these limitations, the study offers several important strengths. First, it contributes a rare longitudinal, real-world assessment of a low-cost infrastructure intervention in a historically underserved urban context. The three-year pre-post design captured both short-term and longer-term changes in bicyclist behavior, while the sizable dataset allowed for robust analysis despite site-level constraints. Second, the study’s findings provide valuable insight into the challenges and opportunities of implementing sharrows, particularly in relation to safety perceptions and equity. This study’s collaborative nature with local government, public health partners, and community stakeholders reflects real-world implementation conditions and enhances the practical relevance of the findings for cities considering similar infrastructure strategies. Finally, this work points to the growing potential for alternative data collection and analysis approaches. For example, AI-powered video analysis, mobile and vehicle-based sensors, and crowd-sourced reporting, can provide scalable, real-time, and high-resolution insights into infrastructure performance and user behavior. As demonstrated in emerging smart city applications, hybrid localization systems and edge computing can further enhance the precision and practicality of such evaluations (Gheorghe & Soica, 2025). In the context of bicycle sharrows, these technologies can be leveraged to assess bicyclist behavior, safety, and lane utilization in real-time, offering crucial data on their effectiveness and the need for adjustments in urban design. Moreover, AI-driven traffic simulations and predictive analytics could model the scalability of sharrows across different urban contexts, helping planners optimize bicycle-friendly infrastructure and ensure the integration of bike lanes into broader smart city ecosystems.
Transportation planning should prioritize equity-focused designs that meet the needs of vulnerable groups, including older adults, women, children, and mobility aid users, by investing in infrastructure that enhances perceived safety, such as protected lanes, traffic calming measures, and inclusive street design layouts. Ongoing evaluation and community engagement are also essential for continued adaptation and success. Transportation agencies should use repeated observations, traffic counts, and user surveys, alongside direct outreach, to understand and improve infrastructure effectiveness and user experience, especially for underrepresented populations. While sharrows are a low-cost option, this study found no lasting increase in ridership or safe bicycling behavior. Policymakers should consider pairing sharrows with education, driver awareness, and clear signage to promote safe shared road use, and future studies should assess the impact of these strategies on safety perceptions and behavior.
Overall, this study contributes to the growing body
of research examining how roadway markings such as sharrows are perceived and
experienced by diverse roadway users. The findings of this study suggest that
while sharrows may help increase awareness of bicycle presence and signal
shared roadway use, their impact on long-term bicycle uptake and perceived
safety appears limited. This current study’s results highlight concerns among
women, older adults, and mobility aid users, indicating that sharrows alone may
not adequately address the needs of all roadway users. These findings suggest
that sharrows are best considered as one component within a broader sect of
active transportation strategies rather than a standalone solution. Future research
should build on these findings by integrating complementary evaluation methods,
such as observational data, traffic counts, and user feedback to deepen
understanding of how infrastructure is used and perceived in real-world
settings. With emerging technologies, such as AI-powered video analysis, mobile
sensors, and community-sourced data platforms, there is opportunity for
capturing real-time insights and informing equitable and scalable
transportation planning. With thoughtful integration and evaluation, sharrows
and other active transportation infrastructure interventions can contribute
meaningfully to safe, healthier, and more accessible streets for all.
Supplemental
Digital Content
N/A
Funding
This research was funded in part by an award from the Centers for Disease Control and Prevention (CDC; No. U58DP005861).
Correspondence should be addressed to
Mojgan Sami, PhD
Department of Public Health, College of Health & Human Development
California State University Fullerton
800 N State College Blvd #606, Fullerton, CA, 92831
657-278-3343
Mojgan Sami: 0000-0002-2941-3779
Soultana Macridis: 0000-0003-2291-9475
Deepak Sharma: 0000-0001-5734-278X
Oladele Ogunseitan: 0000-0003-1317-6219
Financial Disclosure
The authors declare no financial relationships to disclose.
Conflicts of Interest
The authors declare no conflicts of interest.
Acknowledgements
Portions of this project’s work involve the Orange County Partnerships to Improve Community Health (OC-PICH) initiative, also supported by CDC funding. However, the findings and conclusions in this article are those of the authors and do not necessarily represent the official position of CDC. For this study, we thank the Community Action Partnership of Orange County, Madeleine Spencer, Cory Wilkerson, the City of Santa Ana, Latino Health Access, Santa Ana Active Streets Coalition, Dr. Harya Dillon, Steven Sharma, Tyler Mehrbrodt, Sameer Kang, Cory Witter, and Dr. Megan Smith for preliminary analysis.
Author Contributions
Conceptualization, M.S., O.O.; Methodology, M.S., O.O., D.S., S.M.; Investigation, M.S.; Writing – Original Draft, M.S., Writing – Review & Editing, M.S., S.M., D.S., and O.O, Funding Acquisition, O.O.; Resources, O.O.; Supervision, M.S. and O.O.
Creative Commons License
This work is licensed under a Creative Commons Attribution-Noncommercial 4.0 International License (CC BY-NC 4.0).
Human Participant Compliance Statement
This study used non-intrusive, observational survey methods conducted exclusively in public settings. In accordance with U.S. federal regulations, the Institutional Review Board (IRB) at the University of California, Irvine determined that such observational research—where no identifiable private information is collected and no direct interaction with individuals occurs—qualifies for exempt status. The IRB concluded that neither ethical review nor informed consent was required based on the following criteria: (1) individuals observed in public spaces do not possess a reasonable expectation of privacy; and (2) the study involved no direct engagement with those being observed. Nevertheless, the research was conducted in alignment with the ethical principles articulated in the Declaration of Helsinki, with careful attention to privacy and data confidentiality.
References
Bourke, E., Rawstorn, J., Maddison, R., & Blakely, T. (2024). The effects of physical inactivity on other risk factors for chronic disease: A systematic review of reviews. Prev Med Rep, 46, 102866. https://doi.org/10.1016/j.pmedr.2024.102866
Buehler, R., & Dill, J. (2015). Bikeway Networks: A Review of Effects on Cycling. Transport Reviews, 36(1), 9-27. https://doi.org/10.1080/01441647.2015.1069908
Centers for Disease Control and Prevention. (2023). Active People, Healthy Nation: Transportation. https://www.cdc.gov/active-people-healthy-nation/php/tools/transportation.html?utm_source=chatgpt.com
Centers for Disease Control and Prevention. (2024). Adult Obesity Prevalence Maps. Retrieved July 17, 2025 from https://www.cdc.gov/obesity/data-and-statistics/adult-obesity-prevalence-maps.html
De Nazelle, A., Nieuwenhuijsen, M. J., Antó, J. M., Brauer, M., Briggs, D., Braun-Fahrlander, C., Cavill, N., Cooper, A. R., Desqueyroux, H., & Fruin, S. (2011). Improving health through policies that promote active travel: a review of evidence to support integrated health impact assessment. Environ Int, 37(4), 766-777.
Dey, B. K., Anowar, S., Eluru, N., & Hatzopoulou, M. (2018). Accommodating exogenous variable and decision rule
heterogeneity in discrete choice models: Application to bicyclist route choice. PLoS ONE, 13(11), e0208309.
Dill, J., & Carr, T. (2003). Bicycle commuting and facilities in major US cities: if you build them, commuters will use them. Transportation Research Record, 1828(1), 116-123.
Ferenchak, N. N., & Marshall, W. (2016). The relative (in) effectiveness of bicycle sharrows on ridership and safety outcomes.
Ferenchak, N. N., & Marshall, W. E. (2019). Advancing healthy cities through safer cycling: An examination of shared lane markings. International journal of transportation science and technology, 8(2), 136-145.
Fitch-Polse, D., & Agarwal, S. (2025). The benefits of active transportation interventions: A review of the evidence. Journal of Transport and Land Use, 18(1), 77-122.
Fortin, K. (2017). Santa Ana Active Streets is building an equity-centered, resident-led transportation coalition. Retrieved July 16, 2025 from https://cal.streetsblog.org/2017/10/20/santa-ana-active-streets-is-building-an-equity-centered-resident-led-transportation-coalition/
Gheorghe, C., & Soica, A. (2025). Revolutionizing Urban Mobility: A Systematic Review of AI, IoT, and Predictive Analytics in Adaptive Traffic Control Systems for Road Networks. Electronics (2079-9292), 14(4).
Goddard, T. B. (2017). Drivers' Attitudes and Behaviors Toward Bicyclists: Intermodal Interactions and Implications for Road Safety Portland State University].
Hansmann, K. J., Grabow, M., & McAndrews, C. (2022). Health equity and active transportation: a scoping review of active transportation interventions and their impacts on health equity. Journal of Transport & Health, 25, 101346.
Healthy Places by Design. (n.d.). Communities in action: Santa Ana, CA. Retrieved May 2, 2026, from https://healthyplacesbydesign.org/communities-in-action-santa-ana-ca/
Hess, G., & Peterson, M. N. (2015). “Bicycles may use full lane” signage communicates US roadway rules and increases perception of safety. PLoS ONE, 10(8), e0136973.
Hoyer-Kruse, J., Schmidt, E. B., Hansen, A. F., & Pedersen, M. R. L. (2024). The interplay between social environment and opportunities for physical activity within the built environment: a scoping review. BMC Public Health, 24(1), 2361. https://doi.org/10.1186/s12889-024-19733-x
Latino Health Access. (2018). Community engagement and advocacy programs: Wellness Corridor. Retrieved July 16, 2025 from https://www.latinohealthaccess.org/wellness-corridor/
Lawson, A. R., Pakrashi, V., Ghosh, B., & Szeto, W. (2012). Analysis of the perception of safety among cyclists. European Transport Conference 2012 Association for European Transport (AET) Transportation Research Board,
Levine, D. M., Stephan, D. F., & Szabat, K. A. (2016). Statistics for managers using Microsoft Excel. Pearson.
Marquet, O., Hipp, J. A., Alberico, C., Huang, J.-H., Fry, D., Mazak, E., Lovasi, G. S., & Floyd, M. F. (2019). Use of SOPARC to assess physical activity in parks: do race/ethnicity, contextual conditions, and settings of the target area, affect reliability? BMC Public Health, 19(1), 1730.
Mertens, L., Van Dyck, D., Deforche, B., De Bourdeaudhuij, I., Brondeel, R., & Van Cauwenberg, J. (2019). Individual, social, and physical environmental factors related to changes in walking and cycling for transport among older adults: A longitudinal study. Health Place, 55, 120-127.
Mogaji, E., & Uzondu, C. (2022). Equitable active transport for female cyclists. Transportation Research Part D: Transport and Environment, 113. https://doi.org/10.1016/j.trd.2022.103506
Monsere, C. M., McNeil, N., & Dill, J. (2012). Multiuser perspectives on separated, on-street bicycle infrastructure. Transportation Research Record, 2314(1), 22-30.
Noland, R. B., Laham, M. L., & Wang, S. (2023). Understanding preferences for bicycling and bicycle infrastructure. International journal of sustainable transportation, 17(9), 1020-1031.
Orange County Health Care Agency. (2024). Orange County Healthier Together. Retrieved October 8, 2025 from https://www.ochealthiertogether.org/
Sami, M., Macridis, S., & Ogunseitan, O. A. (2025). Evaluating actual use of outdoor exercise equipment in a community park in Southern California through video-captured behavioral assessment. Discover Public Health, 22(1), 598. https://doi.org/10.1186/s12982-025-01002-w
Sanders, R. L. (2015). Perceived traffic risk for cyclists: The impact of near miss and collision experiences. Accident Analysis & Prevention, 75, 26-34.
Santa Ana Active Streets Coalition. (2024). Santa Ana Active Streets. Retrieved July 17, 2025 from https://saascoalition.org/
Schneider, M. (2013). Why do sharrows work better in Long Beach, and do we need to rethink them? Retrieved October 8, 2025 from https://la.streetsblog.org/2013/09/05/why-do-sharrows-work-better-in-long-beach-and-do-we-need-to-rethink-them
Speck, J. (2018). Do Not Use Sharrows as Cycling Facilities: Speedy driving lanes with sharrow markings are not safe. In Walkable City Rules: 101 Steps to Making Better Places (pp. 146-147). Springer.
U.S. Census Bureau. (2024). QuickFacts: Santa Ana city, California. https://www.census.gov/quickfacts/fact/table/santaanacitycalifornia
University of California, L. A. (n.d.). Bicycle Count Data Clearinghouse [Archived December 20, 2019]. Retrieved July 14, 2025 from https://web.archive.org/web/20191220224230/https://bikecounts.luskin.ucla.edu/
University of Wisconsin Population Health Institute. (2024). County Health Rankings & Roadmaps. Retrieved July 17, 2025 from https://www.countyhealthrankings.org/
Vasilev, M., Pitera, K., & Jonsson, T. (2017). Evaluation of bicycle sharrows within the Norwegian context. Transportation research procedia, 27, 1097-1104.
Wegman, F., Zhang, F., & Dijkstra, A. (2012). How to make more cycling good for road safety? [Review]. Accid Anal Prev, 44(1), 19-29. https://doi.org/10.1016/j.aap.2010.11.010
Wen, Y., Liu, B., Li, Y., Chen, X., & Xu, Y. (2025). The spatial heterogeneity effects of street environmental factors on the preference for sports and leisure cycling paths across different street types. BMC Public Health, 25(1), 621.
Winters, M., Babul, S., Becker, H., Brubacher, J. R., Chipman, M., Cripton, P., Cusimano, M. D., Friedman, S. M., Harris, M. A., & Hunte, G. (2012). Safe cycling: how do risk perceptions compare with observed risk? Canadian Journal of Public Health, 103(Suppl 3), S42-S47.
World Health Organization. (2022). Global status report on physical activity 2022. https://www.who.int/publications/i/item/9789240059153
World Health Organization. (2025). Promoting walking, cycling and other fomrs of active mobilities. https://www.who.int/activities/promoting-walking-and-cycling
Yuan, Y., Masud, M., Chan, H., Chan, W., & Brubacher, J. R. (2023). Intersectionality and urban mobility: A systematic review on gender differences in active transport uptake. Journal of Transport & Health, 29, 101572. https://doi.org/https://doi.org/10.1016/j.jth.2023.101572
Zukowska, J., Gobis, A., Krajewski, P., Morawiak, A., Okraszewska, R., Woods, C. B., Volf, K., Kelly, L., Gelius, P., Messing, S., Forberger, S., Lakerveld, J., Braver, N. d., & Bengoechea, E. G. (2022). Which transport policies increase physical activity of the whole of society? A systematic review. Journal of Transport & Health, 27. https://doi.org/10.1016/j.jth.2022.101488