Figure 1. Locations of Hamtramck Public Schools and the Asian American Population by U.S. Census Block Group.
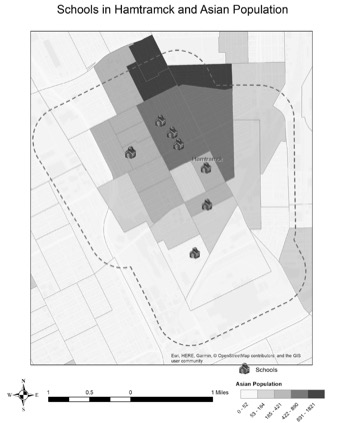
Note: Each geographic unit is symbolized using different color to represent the count of Asian American individuals in Hamtramck
Parental Perceptions and Perceived Environmental Influences on Active Transport to School in U.S. Inner-City Neighborhoods: Through the Lens of Health Equity
Tsu-Yin Wu1, Xining Yang1, Vedhika Raghunathan2 Meng Hu1
1 Eastern Michigan University Center for Health Disparities Innovation and Studies, Ypsilanti,
MI
2 University of Michigan, Ann Arbor, MI
Abstract
Physical inactivity remains high amongst Asian American (AA) children. The Safe Routes to School (SRTS) Program is a viable approach for increasing levels of physical activity by encouraging active transport to school (ATS). The objective of this study was to investigate the factors that affect ATS among Asian American children in inner-city schools. An adapted version of the national SRTS survey that measures socio-demographics, environmental factors, and parental perceptions toward school routes and transportation modes were administered in eight public schools in Hamtramck, Michigan. Multinominal logistic regression results indicated that the age of children, distance to school, perceived school encouragement, and parents’ perceptions on safety were the predominant factors associated with Asian American children participating in ATS. The study is among the first to investigate underserved environmental and access factors that influence Asian American children’s ATS patterns. Particularly, these findings showed that the safety perceptions of parents play a key role in affecting their decisions about ATS and should be considered in future interventions and programming designs to promote ATS.
Keywords: Asian Americans, Walk to School, Healthy Living, Physical Activity.
Introduction
Physical inactivity and sedentary lifestyles are global public health problems. Physical activity has been linked to improved conditions in patients with cardiovascular disease, type 2 diabetes, obesity, and cancer as well as decreasing risk for individuals who have not developed these chronic diseases (Durstine et al., 2013; Warburton et al., 2006). Physical activity among children in the United States is low and remains a significant public health concern. According to the 2016 US Report Card on Physical Activity for Children and Youth, only 21.6% of youth ages 6-19 years in the United States met the recommended overall physical activity goals; overall physical activity was higher among younger children and less than half (42.5%) of children ages 6-11 years met the requirements (Katzmarzyk et al., 2016).
Current literature suggests that there are significant racial and ethnic disparities regarding physical activity practices (Brodersen et al., 2007; Katzmarzyk et al., 2016; Kimbro & Kaul, 2016; Maxwell et al., 2012). One study (Kimbro & Kaul, 2016) conducted found that US-born children had significantly higher rates of physical activity than children born to immigrant mothers; specifically, children born to Southeast and Northeast Asian immigrant mothers had two of the lowest percentages of their children meeting the recommended amount of physical activity per day and were also less likely to participate in team sports. Physically active lifestyles and behaviors are cultivated from an early age and are maintained through adulthood (Telama et al., 2014); lack of such early-life practices can lead to poorer health outcomes later in life. Asian Americans have been documented to have lower levels of physical activity than other racial/ethnic groups (Ogden et al., 2014) and are also more likely to develop hypertension and diabetes at lower body mass index values than other racial/ethnic groups (Wong et al., 2014). Amongst Asian American adults, Vietnamese, Japanese, Chinese, Filipino, and Korean Americans reported lower levels of physical activities when compared to non-Hispanic whites (Maxwell et al., 2012). Thus, it is critical to promote the behavior of physical activity at an early age in order to encourage long term well-being among Asian Americans.
Michigan is home to the second largest Asian population in the Midwest and the Asian American population has been increasing rapidly in the past decade. From 2010 to 2014, Michigan’s Asian population increased by 16.7% while Michigan’s Non-Hispanic White and Black population declined or remained the same (US Census Bureau, 2014b, 2010). From 2014 to 2018, the percent increase of Asian Americans in the state was approximately 17.9%. (US Census Bureau, 2018, 2014b) According to the 2018 American Community Survey, 393,744 Michigan residents identified themselves as Asian American alone or in any combination and accounted for 3.9% of the population (US Census Bureau, 2018). As of 2019, approximately 6,784 individuals identifying as Asian alone or in combination with another race lived in Hamtramck City (US Census Bureau, 2019), a city in Wayne County in the U.S. state of Michigan. Approximately 50.1% of this population identified as Bangladeshi and about 46.9% of the Bangladeshi Americans in Michigan reside in Hamtramck (US Census Bureau, 2019). The Bangladeshi population in Hamtramck increased by 12.7% between 2017 and 2019 while the Black population declined by 15.5% during this same time period (US Census Bureau, 2019, 2017).
Safe Routes to School (SRTS) programs have emerged as a viable option to integrate physical activity into everyday life and maintain or increase physical activity levels among school-aged children. Developed as an initiative of the US Department of Transportation, the SRTS program aims to incorporate walking, biking, and other forms of active transportation to school (ATS) (McDonald et al., 2014; Stewart, 2011; Stewart et al., 2014). Studies have indicated that ATS is associated with reduced body mass index (BMI) scores, increased daily moderate-to-vigorous physical activity both before and after school, increased aerobic fitness levels, and improved mental health among children (Stewart et al., 2014). Studies have investigated a number of factors that are associated with ATS. Distance from home to school is the leading predictor of ATS in youth (Carver et al., 2010; Centers for Disease Control and Prevention [CDC], 2002). In addition, socio-economic characteristics (McDonald et al., 2011; McMillan et al., 2006), built environmental factors (e.g., busy roads, unsafe crosswalks or sidewalks), parental concerns for safety (Carver et al., 2010; Stewart, 2011), and parental preferences (McDonald & Aalborg, 2009; Stewart, 2011) as well as policies have shown to be factors that encourage or discourage children’s ATS behavior (Banerjee et al., 2014).
Understanding how multi-faceted factors interact and influence children’s ATS in a local context will enable the community, policymakers, researchers, city planners, and public health officials to address ATS barriers and reduce the reliance on motorized transport for this age group. The existing literature includes relatively few ATS studies which focus on minority children such as Asian Americans and factors related to their ATS. This study aimed to extend the literature by exploring Asian American children's school travel experiences in an inner city. Insights from this study has the potential for future development and implementation of local SRTS programs and to improve health equity in adopting effective ATS strategies among Asian American communities.
Methods
Participants
Parents from eight Hamtramck public schools (HPS) were recruited to participate in the study conducted in the spring and summer of 2019. A total of 8 schools in HPS participated in the current study; the study schools had a range of Asian American students enrolled during this time from 3-38%. and majority of the Asian American students at these schools were Bangladeshi American. More than 90% of students from 7 of 8 schools received free or reduced-price meals. Surrounded by Detroit, Hamtramck has an area of 2.01 square miles and has one of the nation’s densest clusters of Bangladeshi Americans. According to the 2019 American Community Survey, 26% of Hamtramck residents identified as Asians, with over half the Asian population consisting of people identifying as Bangladeshi (50.1%) (US Census Bureau, 2019). Given the large Asian population including a large Bangladeshi population in Hamtramck, the current study focused on this group.
Procedure
An environmental assessment on the geographic distribution of schools and children population was conducted in the study area. The 8 schools in the study were geocoded using the corresponding address in Geographic Information System (GIS). Our team used data from 2013-2017 U.S. American Community Survey along with U.S. Census Bureau Topologically Integrated Geographic Encoding and Referencing (TIGER) GIS layer to estimate the population including children (US Census Bureau, n.d.), and Asian Americans at the census block group scale. The map serves as a stand-alone visual aid to illustrate a zoomed-in perspective of the children population composition of the census block groups surrounding the location of the schools. Figure 1 illustrates that the distribution of the Asian American population varies within the geographic area with the majority living in areas in northern Hamtramck (US Census Bureau, 2017). There is a large Asian American population observed from northeastern Hamtramck and its surrounding area.
Figure 1. Locations of Hamtramck Public Schools and the Asian American Population by U.S. Census Block Group.
Note: Each geographic unit is symbolized using different color to represent the count of Asian American individuals in Hamtramck
Data were collected from a convenience sample of parents whose children were attending eight Hamtramck public schools. In the school setting, the principal and teachers were acting as survey administrators to distribute surveys to students. Each administrator was trained and provided clear directions so that the children from school could bring the survey packages to parents and return them to school upon completion by their parents. In the community setting, a community health worker was hired to distribute survey packages to clients during community health events. Participants with children attending Hamtramck public schools were eligible to participate in the study and the survey was completed on-site during the health event. The instructions were provided to participants about not completing the survey more than once. The study protocol was reviewed and approved by Eastern Michigan University’s Institutional Review Board. The consent forms and surveys in Arabic, Bengali and English were distributed in both paper and digital format to study participants with assistance from community health workers. The translations were done by two experienced translators independently, compared their translations and have the final version agreed on by both translators. In areas in which discrepancies were noted, the translation was reviewed among translators to ensure an appropriate solution was identified.
Study Instrument
The study team utilized the nationally recognized SRTS survey (Federal Highway Administration, n.d.) to measure children’s transportation mode from/to school and parental perceptions of reasons they may or may not use ATS with an open-ended format. The study SRTS survey included items measuring socio-demographics (e.g., age, race, parent education level, grades the children attended, etc.), perceived neighborhood factors (e.g., perceived proximity of the school, travel time, traffic safety/crime, etc.), and parental perceptions that if changed will affect their decisions for ATS. In addition, parents’ attitudes on school encouragement, enjoyment, and health benefits of ATS were measured on a 5-point Likert scale. More than 80% of parent participants opted to use the Bengali version of study instruments which indicated high percentage of participants with limited English proficiency.
Data Analysis
Data were analyzed with the Statistical Package for the Social Sciences (SPSS) version 24. Descriptive statistics for the demographic variables, neighborhood and parental attitudes, and ATS were performed. Chi-square and independent group t-test analyses were performed on all variables to determine whether factors differed between active transport versus non-active transport children. In addition, logistic regression and adjusted odds ratios were used to examine relationships between demographic variables and the dependent variable, active transport to schools. All analyses were two-tailed and deemed significant if p<0.05.
Results
Demographic
A total of 127 parents with children attending Hamtramck schools were recruited and completed a SRTS survey. The majority of the parents in the study were Asian (64.6%), followed by white (15.7%); 17% chose not to disclose their ethnic identity. Similar gender distribution of male (52.0%) and female (48.0%) children were included in the study whereas sixth grade had the highest percentage of participants (16.7%) followed by second grade (15.9%), third grade (12.7%), and eleventh grade (11.9%). The most common response to the highest educational degree among parents was high school education (21.6%) (see Table 1) and 19.2% of parents chose not to answer this question.
Table 1. Descriptive statistics of participant demographics and ATS variables
|
Characteristic |
Frequency |
Percentage (%) |
|
Race (n=127) Asian Hispanic or Latino White Black or African American Native Hawaiian or Other Pacific Islander American Indian or Alaskan Native Two or more races Choose not to answer |
82 0 20 1 0 0 3 21 |
64.6 0 15.7 0.8 0 0 2.4 16.5 |
|
Gender of child (n=127) Male Female |
66 61 |
52.0 48.0 |
|
Grade of child (n=126) Pre-Kindergarten/Kindergarten Elementary (1st – 5th Grade) Middle School (6th – 8th Grade) High School (9th – 12th Grade) |
10 61 27 28 |
7.9 48.4 21.4 22.2 |
|
Number of children in Kindergarten through 8th grade in household (n=112, mean=1.80, SD=1.09) 0 1 2 3 4 5 |
10 37 41 14 9 1 |
8.9 33.0 36.6 12.5 8.0 0.9 |
|
Highest level of education of parent (n=125) Elementary schooling (Grades 1-8) Some high school (Grades 9-11) High school graduate (Grade 12 or GED) Some college or technical school (College 1-3 years) College graduate (College 4 years or more) Prefer not to answer |
22 21 27 11 20 24 |
17.6 16.8 21.6 8.8 16.0 19.2 |
|
How child arrives to school (n=127) Walk Bike School bus Family vehicle Carpool Transit Other Two or more methods |
55 1 14 46 7 0 1 3 |
43.3 0.8 11.0 36.2 5.5 0 0.8 2.4 |
|
How child leaves school (n=126) Walk Bike School bus Family vehicle Carpool Transit Other Two or more methods |
60 1 19 36 7 0 0 3 |
47.6 0.8 15.1 28.6 5.6 0 0 2.4 |
|
Distance to school (n=127) Less than a 1/4 mile 1/4 mile-1/2 mile 1/2 mile-1 mile 1 mile-2 miles More than 2 miles Don’t know |
37 10 19 3 41 17 |
29.1 7.9 15.0 2.4 32.3 13.4 |
|
Travel time to school (n=125) Less than 5 minutes 5-10 minutes 11-20 minutes More than 20 minutes Don’t know/not sure |
33 59 23 6 4 |
26.4 47.2 18.4 4.8 3.2 |
|
Travel time from school (n=118) Less than 5 minutes 5-10 minutes 11-20 minutes More than 20 minutes Don’t know/not sure |
21 55 22 9 11 |
17.8 46.6 18.6 7.6 9.3 |
|
Grade parent would allow child to walk or bike to/from school (n=123) Pre-Kindergarten Kindergarten First Grade Second Grade Third Grade Fourth Grade Fifth Grade Sixth Grade Seventh Grade Eighth Grade Ninth Grade Tenth Grade Eleventh Grade Twelfth Grade Not comfortable at any grade |
0 1 0 3 11 5 4 7 6 3 12 9 1 1 60 |
0 0.8 0 2.4 8.9 4.1 3.3 5.7 4.9 2.4 9.8 7.3 0.8 0.8 48.8 |
|
School encouragement to walk or bike to/from school (n=122) Strongly encourages Encourages Neither Discourages Strongly discourages |
10 52 49 6 5 |
8.2 42.6 40.2 4.9 4.1 |
|
Parent beliefs about entertainment of walking or biking to/from school (n=127) Very fun Fun Neutral Boring Very boring |
20 39 56 7 5 |
15.7 30.7 44.1 5.5 3.9 |
|
Parent beliefs about health benefits from walking or biking to/from school (n=127) Very healthy Healthy Neutral Unhealthy Very unhealthy |
40 53 22 11 1 |
31.5 41.7 17.3 8.7 0.8 |
Current Transport Practices & Parental Attitudes
The two modes of transport with the highest percentage of responses for how children arrive and leave school were walking (43.3% arriving and 47.6% leaving) and using a family vehicle (36.2% arriving and 28.6% leaving). Most of the participants lived less than 1 mile from the school (52.0%) (Table 1). In terms of parental attitudes toward ATS, more than half of participants at various grade levels reported they were comfortable letting their child walk or bike to/from school (51.2%). They also reported that they felt that the school encourages ATS (42.6%), ATS was fun (30.7%), and walking or biking to/from school was either very healthy (31.5%) or healthy (41.7%).
Factors Affecting ATS
To determine if there were any differences between race, grade of the child, and parent education in ATS, a Chi-square goodness of fit test was calculated. There were no statistically significant differences in ATS transport both to and from school based on race or parent education. However, differences existed across grade groups of the children where more elementary students (K-5th) took vehicular transport to and from school respectively while the older (grades 9-12) students took active transport to and from school, and the difference was statistically different (χ2(1)=13.378, p=0.001 ATS from school and χ2(1)=16.791, p=0.000 ATS to school) (see Table 2).
Table 2. ATS with Demographic and Neighborhood Correlates
|
Demographic characteristic |
Walk/bike to school (%) |
Vehicular transport to school (%) |
χ2 (df)
|
p-value |
|
Race Asian Other |
41 (51.9) 6 (30.0) |
38 (48.1) 14 (70.0) |
3.069 (1) |
0.080 |
|
Grade of child Elementary (K-5) Grades 6-8 Grades 9-12 |
22 (32.4) 13 (48.1) 20 (80.0) |
46 (67.6) 14 (52.9) 5 (20.0) |
16.791 (2) |
<.0001*
|
|
Parent education Below high school High school/some college College graduate |
21 (50.0) 11 (31.4)
8 (42.1) |
21 (50.0) 24 (68.6)
11 (57.9) |
2.711 (2) |
0.258 |
|
Distance Less than 1/4 mile 1/4 mile to 1/2 mile 1/2 mile to 1 mile 1 mile to 2 miles More than 2 miles |
22 (64.7) 4 (40.0) 6 (33.3) 1 (33.3) 14 (34.1) |
12 (35.3) 6 (60.0) 12 (66.7) 2 (66.7) 27 (65.9)
|
8.584 (4) |
0.073 |
|
|
Walk/bike from school (%) |
Vehicular transport from school (%) |
χ2 (df)
|
p-value |
|
Race Asian Other |
44 (55.0) 7 (33.3) |
36 (45.0) 14 (66.7) |
3.124 (1) |
0.077 |
|
Grade of child Elementary (K-5) Grades 6-8 Grades 9-12 |
25 (36.2) 15 (57.7) 20 (76.9) |
44 (63.8) 11 (42.3) 6 (23.1) |
13.378 (2) |
0.001* |
|
Parent education Below high school High school/some college College graduate |
22 (51.2) 12 (33.3) 9 (47.4) |
21 (48.8) 24 (66.7) 10 (52.6) |
2.646 (2) |
0.266 |
|
Distance Less than 1/4 mile 1/4 mile to 1/2 mile 1/2 mile to 1 mile 1 mile to 2 miles More than 2 miles |
25 (69.4) 4 (40.0) 6 (33.3) 1 (33.3) 15 (36.6)
|
11 (30.6) 6 (60.0) 12 (66.7) 2 (66.7) 26 (63.4)
|
10.829 (4) |
0.029* |
*Statistically significant p<0.05.
The results also showed that the proportion of children walking or biking to school decreased with increasing distance (especially when greater than a half mile). According to the reports from parents’ surveys, 35.3% of children living within a quarter mile of school and 60% living within a quarter to a half mile chose a family vehicle as the transportation mode to school. This trend was true for trips both to and from school (Table 2).
When queried about the factors that if changed would affect parents’ allowing children to walk or bike to/from school among those who did not allow their children to walk or bike, additional factors emerged to be influencing their decisions. These included improving or changing sidewalks/pathways (62.5%), safety at intersections and crossings (66.7%), crossing guards (52.5%), and weather/climate (59.4%) would affect their decisions to allow their children to walk or bike to/from school (Table 3).
Table 3. Descriptive statistics of factors that if improved/changed would affect parents to allow children to walk or bike to/from school
|
Factors |
Frequency |
Percentage |
|
Distance (n=74) Yes No Not sure |
24 35 15 |
32.4 47.3 20.3 |
|
Convenience of driving (n=63) Yes No Not sure |
18 30 15 |
28.6 47.6 23.8 |
|
Time (n=62) Yes No Not sure |
18 33 11 |
29.0 53.2 17.7 |
|
Before/after school activities (n=55) Yes No Not sure |
15 32 8 |
27.3 58.2 14.5 |
|
Speed of traffic along route (n=63) Yes No Not sure |
17 35 11 |
27.9 55.6 17.5 |
|
Amount of traffic along route (n=56) Yes No Not sure |
17 29 10 |
30.4 51.8 17.9 |
|
Adults to accompany children (n=58) Yes No Not sure |
18 30 10 |
31.0 51.7 17.2 |
|
Sidewalks/pathways (n=64) Yes No Not sure |
40 15 9 |
62.5 23.4 14.1 |
|
Safety of intersections and crossings (n=69) Yes No Not sure |
46 15 8 |
66.7 21.7 11.6 |
|
Crossing guards (n=61) Yes No Not sure |
32 15 14 |
52.5 24.6 23.0 |
|
Violence/crime (n=63) Yes No Not sure |
20 29 14 |
31.7 46.0 22.2 |
|
Weather/climate (n=69) Yes No Not sure |
41 15 13 |
59.4 21.7 18.8 |
Multivariate Analysis of ATS Predictors
Multinomial logistic regression analysis was performed to determine factors that affected the mode of transport to school. The predictor variables were selected based on previous similar SRTS studies; these predictors were parental education, distance from school, perceived school encouragement, perceived entertainment of walking or biking, and perceived health benefits from walking and biking. The model accounted for 34.5% of the total observed variation in the mode of transport to school (Nagelkerke R2) and the Hosmer-Lemeshow test of the goodness of fit suggested the model is a good fit to the data (χ2 (8)=12.589, p=0.127). The results showed that participants whose residence was within a quarter mile of the school were 5.277 times more likely than those who were more than a quarter mile (reference category) for reporting ATS. Similarly, those who perceived favorable encouragement from the school were 4.106 times likely to report ATS (Table 4).
Table 4. Multiple logistic regression of factors affecting current child engagement with ATS
|
Factor |
Adjusted odds ratios (95% confidence interval) |
|
Distance from school Less than 1/4 mile More than 1/4 mile |
5.277 (1.708, 16.303)* Reference |
|
Parent education Some college or less College graduate |
0.384 (0.091, 1.618) Reference |
|
Perceived school encouragement Very encouraging/encouraging Other |
4.106 (1.182, 14.265)* Reference |
|
Perceived entertainment of walking/biking Very fun/fun Other |
1.800 (0.551, 5.881) Reference |
|
Perceived health benefits from walking/biking Very healthy/healthy Other |
1.244 (0.314, 4.928) Reference |
ATS reference: Vehicular transport; * Statistically significant: p<0.05
Discussion
Asian American Children and ATS
Based on the review of literature, Asian American children face a unique disparity in physical activity. This study extends the literature by investigating ATS with a predominantly Asian American population and immigrant families who reside in an low-resource urban neighborhood. Our findings highlight demographic, neighborhood, and built environment factors which influenced ATS behaviors and parental decisions for allowing their children to use active transport (walk and/or bike) to school. In particular, this paper also acknowledges that additional factors, if changed, could affect parents’ decisions for allowing their children to take ATS. The study findings showed that Asian American parents reported a greater proportion of their children took ATS (with 51.9% to school and 55% from school) and these were higher than the rates reported in the 2017 National Household Travel survey where only 5.8% of Asian households reported walking or biking to school (U.S. Department of Transportation, 2017). Our findings were consistent with an earlier CDC report that documented ATS being higher amongst recipients of the free and reduced-price meals program and as English language learners (National Center for Injury Prevention and Control, n.d.).
Differences in ATS to and from school
Distance between the school and home is the primary determinant factor of children’s ATS. While this study’s results showed children living within a quarter mile are more likely to walk or bike to/from school similar to a report in another study (Banerjee et al., 2014), we also noticed that more children reported using ATS are from school than to school which could mean that the trip to school and the trip from school are two distinct events and therefore, have been influenced by different mobility needs. Based on qualitative responses from participants, the trip to school in the morning was more a matter of expediency and time which results in less participation in ATS whereas the trip from school was influenced by parents’ preference of transportation, children’s afterschool activities, and social support available with relatives and friends.
As a result, while existing research generally views school travel as a single event, this current study shows that among Asian American children, ATS to school versus from school could be perceived as two different events with different factors affecting both. The results suggest a need for strategies to further address each trip separately to better encourage ATS to and from school.
Safety Perceptions and Key Influencing Factors
The results of this study indicated that the safety perceptions of parents play a key role in affecting their decisions to allow their children to walk or bike to school. Almost half (48.8%) of parents reported not being comfortable letting their child of any age walk or bike to/from school. However, some factors, if changed, could affect their decisions and to allow their child to walk or bike to or from school; these factors were safety at intersections and crossings, improving or changing sidewalks/pathways, weather/climate, and crossing guards while speed or amount of traffic along route and adults accompanying their children would not affect them. Parental perceptions on safety have been found to play a critical role in walking rates of children going to school with concerned parents being less likely to allow their children to walk to or from school and specific road conditions and environments can influence parents’ perceptions of safety (Evers et al., 2014). In addition, Evers et al. (2014) found that an absence of street trees, lack of sidewalk access, lack of wheelchair accessibility, tripping hazards, and obstructions were all associated with parents seeing those areas as unsafe for their children to walk. Ahlport and colleagues (2008) identified similar deterrents including a lack of crossing guards, sidewalks, inclement weather, and busy roads and intersections as barriers for parents allowing their children to walk or bike to and from school. Furthermore, studies have found that parents often mention their children lacking the adequate road safety skills necessary in walking or biking to school (Ahlport et al., 2008; Wen et al., 2008). Interestingly, parental-perceived safety factors have not only played a role in the amount of ATS but also have been found to lower moderate-to-vigorous physical activity amongst children and youth (Carver et al., 2010; Weir et al., 2006).
Therefore, the results of this study as well as others suggest that addressing parental safety concerns of their children walking or biking to school is critical in promoting ATS among children. SRTS programming within this community should be prioritized to address key factors including interventions such as walking school buses (i.e., a group of children who walk to school together with one or more adults) or instituting crossing guards at major intersections; these can ameliorate parental concerns and allow children to safely travel to and from school and gain physical activity benefits. While parents’ sense of safety may be increased by SRTS interventions, additional policy, systems, and environmental measures such as completion of sidewalks or installment of additional traffic signals can result in long-term behavioral change and increase the levels of physical activity among children.
The CDC report documented pedestrian injury rates were much higher for minority children and youth (National Center for Injury Prevention and Control, n.d.); as a result, improving safety of walking to/from school to reduce child pedestrian injuries needs to be considered as a priority. Policy makers can place special emphasis and focus on schools that are disproportionately urban, with large low-income and minority populations of children to address inequity and health disparities for adopting local STRS programs.
Role of School Environment and ATS
Similar to Gustat and colleagues’ (2015) study, our study results also indicated that schools play an important role in determining parental decisions to allow their children to walk or bike to/from school; therefore, schools can be an ideal venue for hosting educational workshops on safety and ATS or organizing a variety of activities aimed to encourage students walking and/or biking to and from school. Schools, in collaboration with community partners, could also introduce a road safety course for children and parents.
Schools may also consider adopting new policies to support the walk and bike to school program by addressing some of the ATS barriers shown in this study. For instance, an early dismissal policy providing incentives for walking/biking children could help to ease the traffic congestion during the school pick-up time. Future SRTS programs might benefit from working extensively with schools and helping them set up such initiatives in order to motivate parents and children, ultimately, increase ATS behavior.
Limitations
Study limitations include a relatively small convenience sample and relying on parental recall for the report of transport to school; however self-report has been used in other ATS studies with acceptable reliability and validity (Evenson et al., 2008). While the study included other racial/ethnic groups, the study is limited by the majority of participants being Asian Americans and our study findings are specific to Asian American children who live in a neighborhood surrounded by Detroit and cannot be generalized to children from suburban and urban communities elsewhere.
We hope to expand our work in the future to include a larger and more representative sample and future research can add to the contribution of the current research by engaging children who can provide their experiences and perceptions of ATS to gain a deeper understanding and perspectives on correlates of ATS.
Conclusions
Despite these limitations, the current study makes an important contribution to the gap in knowledge of experiences of neighborhood and school factors, and parental attitudes toward ATS among Asian American parents. Parental perceptions and beliefs are demonstrated as attributes influencing their decisions to allow their children to walk or bike to/from school. Understanding how these factors interact and influence transportation choices among Asian Americans in a local context will enable the schools, policymakers, city planners, researchers, and practitioners to work together in addressing ATS barriers and reducing reliance on vehicle transport. Involving parents will impact family habits and may promote children’s healthy active commute to and from school, which can ultimately increase their physical activity.
Correspondence should be addressed to:
Tsu-Yin Wu
328 Marshall Building
Ypsilanti, MI 48197
734-487-2297
Tsu-Yin
Wu: 0000-0003-0751-8884
Xining
Yang: 0000-0001-5781-2497
Vedhika
Raghunathan: 0000-0002-1484-0524
Author Contributions
Conceptualization, T.Y.W. and X.N.Y.; Methodology, T.Y.W. and X.N.Y.; Investigation, T.Y.W., X.N.Y., M.H. and V.R.; Writing – Original Draft, T.Y.W. and V.R.; Writing – Review & Editing, X.N.Y. ,M.H.; Funding Acquisition, T.Y.W.; Resources, T.Y.W., X.N.Y. and M.H.; Supervision, X.N.Y. and T.Y.W.
Acknowledgments
The authors would like to thank all the individuals who shared their time and experience with the study team. We acknowledge Saiful Mohammad Islam for his invaluable assistance in data collection, George Hill from Dickinson East Elementary School for his support in implementing the survey, translation assistance from Karam Khattab and Shabina Chowdhury, Szu-Hsien Chen, Rita Wang, and Alice Jo Rainville for their editorial assistance in improving the manuscript.
Conflict of Interest Statement:
We have no conflicts of interest to disclose.
Creative Commons License:
This work is licensed under a Creative Commons Attribution-Noncommercial 4.0 International License (CC BY-NC 4.0).
Human Subjects Approval Statement
The study protocol was reviewed and approved by Eastern Michigan University’s Institutional Review Board.
Funding
This work was supported by the CDC-Racial Ethnic Approaches toward Community Health (REACH) under Grant # NU58DP006590.
References
Ahlport, K. N., Linnan, L., Vaughn, A., Evenson, K. R., & Ward, D. S. (2008). Barriers to and facilitators of walking and bicycling to school: Formative results from the non-motorized travel study. Health Education & Behavior, 35(2), 221–244. http://www.jstor.org/stable/45055755
Banerjee, T., Uhm, J., & Bahl, D. (2014). Walking to school: The experience of children in inner city Los Angeles and implications for policy. Journal of Planning Education and Research, 34(2), 123–140. https://doi.org/10.1177/0739456X14522494
Brodersen, N. H., Steptoe, A., Boniface, D. R., & Wardle, J. (2007). Trends in physical activity and sedentary behaviour in adolescence: Ethnic and socioeconomic differences. British journal of sports medicine, 41(3), 140–144. https://doi.org/10.1136/bjsm.2006.031138
Carver, A., Timperio, A., Hesketh, K., & Crawford, D. (2010). Are children and adolescents less active if parents restrict their physical activity and active transport due to perceived risk? Social science & medicine, 70(11), 1799–1805. https://doi.org/10.1016/j.socscimed.2010.02.010
Centers for Disease Control and Prevention (CDC) (2002). Barriers to children walking and biking to school--United States, 1999. MMWR. Morbidity and mortality weekly report, 51(32), 701–704.
Durstine, J. L., Gordon, B., Wang, Z., & Luo, X. (2013). Chronic disease and the link to physical activity. Journal of Sport and Health Science, 2(1), 3-11. https://doi.org/10.1016/j.jshs.2012.07.009
Evenson, K. R., Neelon, B., Ball, S. C., Vaughn, A., & Ward, D. S. (2008). Validity and reliability of a school travel survey. Journal of physical activity & health, 5 Suppl 1(Suppl 1), S1–S15. https://doi.org/10.1123/jpah.5.s1.s1
Evers, C., Boles, S., Johnson-Shelton, D., Schlossberg, M., & Richey, D. (2014). Parent safety perceptions of child walking routes. Journal of transport & health, 1(2), 108–115. https://doi.org/10.1016/j.jth.2014.03.003
Federal Highway Administration. (n.d.). National Household Travel Survey. https://nhts.ornl.gov/
Gustat, J., Richards, K., Rice, J., Andersen, L., Parker-Karst, K., & Cole, S. (2015). Youth walking and biking rates vary by environments around 5 Louisiana schools. The Journal of school health, 85(1), 36–42. https://doi.org/10.1111/josh.12220
Katzmarzyk, P. T., Denstel, K. D., Beals, K., Bolling, C., Wright, C., Crouter, S. E., McKenzie, T. L., Pate, R. R., Saelens, B. E., Staiano, A. E., Stanish, H. I., & Sisson, S. B. (2016). Results from the United States of America's 2016 report card on physical activity for children and youth. Journal of physical activity & health, 13(11 Suppl 2), S307–S313. https://doi.org/10.1123/jpah.2016-0321
Kimbro, R. T., & Kaul, B. (2016). Physical activity disparities between US-born and immigrant children by maternal region of origin. Journal of immigrant and minority health, 18(2), 308–317. https://doi.org/10.1007/s10903-015-0180-6
Macridis, S., & García Bengoechea, E. (2015). Adoption of safe routes to school in Canadian and the United States contexts: Best practices and recommendations. The Journal of school health, 85(8), 558–566. https://doi.org/10.1111/josh.12283
Maxwell, A. E., Crespi, C. M., Alano, R. E., Sudan, M., & Bastani, R. (2012). Health risk behaviors among five Asian American subgroups in California: Identifying intervention priorities. Journal of immigrant and minority health, 14(5), 890–894. https://doi.org/10.1007/s10903-011-9552-8
McDonald, N. C., & Aalborg, A. E. (2009). Why parents drive children to school: Implications for safe routes to school programs. Journal of the American Planning Association, 75(3), 331-342. https://doi.org/10.1080/01944360902988794
McDonald, N. C., Dwelley, A. E., Combs, T. S., Evenson, K. R., & Winters, R. H. (2011). Reliability and validity of the safe routes to school parent and student surveys. The International Journal of Behavioral Nutrition and Physical Activity, 8(1), 56-56. https://doi.org/10.1186/1479-5868-8-56
McDonald, N. C., Steiner, R. L., Lee, C., Rhoulac Smith, T., Zhu, X., & Yang, Y. (2014). Impact of the safe routes to school program on walking and bicycling. Journal of the American Planning Association, 80(2), 153-167. https://doi.org/10.1080/01944363.2014.956654
McMillan, T., Day, K., Boarnet, M., Alfonzo, M., Anderson, C. (2006). Johnny Walks to School—Does Jane? Sex Differences in Children’s Active Travel to School. Children, Youth and Environments, 16(1), 75–89. https://escholarship.org/uc/item/22f7k6z8
National Center for Injury Prevention and Control. (n.d.). Web-based Injury Statistics Query and Reporting System: Mortality reports 2007. Centers for Disease Control and Prevention. https://www.cdc.gov/injury/wisqars/index.html
Ogden, C. L., Carroll, M. D., Kit, B. K., & Flegal, K. M. (2014). Prevalence of childhood and adult obesity in the united states, 2011-2012. JAMA: The Journal of the American Medical Association, 311(8), 806-814. https://doi.org/10.1001/jama.2014.732
Rodríguez, A., & Vogt, C. A. (2009). Demographic, environmental, access, and attitude factors that influence walking to school by elementary school-aged children. The Journal of school health, 79(6), 255–261. https://doi.org/10.1111/j.1746-1561.2009.00407.x
Smith, L., Norgate, S. H., Cherrett, T., Davies, N., Winstanley, C., & Harding, M. (2015). Walking school buses as a form of active transportation for children-a review of the evidence. The Journal of school health, 85(3), 197–210. https://doi.org/10.1111/josh.12239
Stewart, O. (2011). Findings from Research on Active Transportation to School and Implications for Safe Routes to School Programs. Journal of Planning Literature, 26(2), 127–150. https://doi.org/10.1177/0885412210385911
Stewart, O., Moudon, A. V., & Claybrooke, C. (2014). Multistate evaluation of safe routes to school programs. American Journal of health promotion: AJHP, 28(3 Suppl), S89–S96. https://doi.org/10.4278/ajhp.130430-QUAN-210
Telama, R., Yang, X., Leskinen, E., Kankaanpää, A., Hirvensalo, M., Tammelin, T., Viikari, J. S., & Raitakari, O. T. (2014). Tracking of physical activity from early childhood through youth into adulthood. Medicine and science in sports and exercise, 46(5), 955–962. https://doi.org/10.1249/MSS.0000000000000181
U.S. Census Bureau. (2019). 2019 American Community Survey 5-Year Estimates. https://data.census.gov/
U.S. Census Bureau. (2018). 2018 American Community Survey 1-Year Estimates. https://data.census.gov/
U.S. Census Bureau. (2017). 2017 American Community Survey 5-Year Estimates. https://data.census.gov/
U.S. Census Bureau. (2014b). 2014 American Community Survey 1-Year Estimates. https://data.census.gov/
U.S. Census Bureau. (2010). 2010 American Community Survey 1-Year Estimates. https://data.census.gov/
U.S. Census Bureau. (n.d.). TIGER/Line Shapefiles: Map. https://www.census.gov/geographies/mapping-files/time-series/geo/tiger-line-file.html
U.S. Department of Transportation. (2017). Summary of Travel Trends: 2017 National Household Travel Surveys. https://https://nhts.ornl.gov/assets/2017_nhts_summary_travel_trends.pdf
Warburton, D. E., Nicol, C. W., & Bredin, S. S. (2006). Health benefits of physical activity: the evidence. CMAJ : Canadian Medical Association journal = journal de l'Association medicale canadienne, 174(6), 801–809. https://doi.org/10.1503/cmaj.051351
Weir, L. A., Etelson, D., & Brand, D. A. (2006). Parents' perceptions of neighborhood safety and children's physical activity. Preventive medicine, 43(3), 212–217. https://doi.org/10.1016/j.ypmed.2006.03.024
Wen, L. M., Fry, D., Rissel, C., Dirkis, H., Balafas, A., & Merom, D. (2008). Factors associated with children being driven to school: implications for walk to school programs. Health education research, 23(2), 325–334. https://doi.org/10.1093/her/cym043
Wong, R. J., Chou, C., Sinha, S. R., Kamal, A., & Ahmed, A. (2014). Ethnic disparities in the association of body mass index with the risk of hypertension and diabetes. Journal of community health, 39(3), 437–445. https://doi.org/10.1007/s10900-013-9792-8
Yoon, H., Choi, K., Kim, J., & Jang, Y. (2021). Neighborhood Walkability, Personal Active Travel, and Health in Asian Americans: Does English Proficiency Matter? Journal of Transport & Health, 21, 101082. https://doi.org/10.1016/j.jth.2021.101082