Places for Healthy Play: A Multi-Pronged
Evaluation of Context, Design, and Perceptions for Play Space Improvements
Yvonne L. Michael1, D. S. Nicholas2,
Debra Ruben2, Nancy Epstein3, Stephen T. Dickinson4,
and Jana A. Hirsch1,4
1Department of Epidemiology and Biostatistics, Dornsife School of Public
Health, Drexel University, USA
2 Department of Interior Design, and Department of Sustainability in the
Built Environment, Antoinette Westphal College of Media Arts &
Design, Drexel University, USA
3 Department of Community Health and Prevention, Dornsife School of
Public Health, Drexel University, USA
4Urban Health Collaborative, Dornsife School of Public Health, Drexel
University, USA
Abstract
Community design interventions have
prioritized the creation of quality play space, especially in easy to access
public places, to improve health outcomes and to reduce health inequities.
Evaluations of health-relevant play interventions often fail to assess
essential context, design, and perceptions. The Play Everywhere Philadelphia
Challenge, led by KABOOM!, funded 16 play spaces to support child health and
development and literacy skills for low-income neighborhoods across
Philadelphia. In June-October 2022, our interdisciplinary team conducted a
process evaluation of completed play space installations (k=9) to identify site
aspects that facilitated greater use. We mapped neighborhood context (e.g.,
child amenities, sociodemographics, pedestrian and bike accessibility), and
conducted direct and systematic observations of play space design (e.g.,
signage, shade), visitation (i.e., number of visitors/hour), and engagement. We
summarized visitation and engagement across contextual and design data. While
many visitors passed through sites, over half of the children we observed
engaged with the installation. Installations with poor condition (i.e.,
cleanliness and maintenance) had the lowest visitation and engagement. More
active/kinetic installations drew more children and engagement. This process evaluation
comprehensively analyzed play space design elements and neighborhood context and
provides evidence to inform recommendations to increase use of urban play
spaces.
Keywords: play, public space, evaluation, health inequities,
systematic observation, children
Play is
understood as an activity that is for enjoyment and recreation (Nijhof et al., 2018). Regardless of form, play is essential for children’s
cognitive and social development and beneficial for physical and mental health (Dankiw et al., 2020; Hartig et al., 2014;
Lillard et al., 2013). Play is
hypothesized to enhance overall health through multiple pathways, including
cognitive development (e.g., problem solving, language development), social
development (e.g., social interaction, conflict resolution), physical
development (e.g., fine and gross motor skills, physical fitness), and mental
health and wellbeing (e.g., stress reduction, resilience) (Nijhof et al., 2018).
Evidence
suggests that opportunities for play have declined in quality and number,
especially in urban areas (Krishnamurthy, 2019). Additionally, opportunities for play are not
equitably distributed, with children living in poor and racially segregated
neighborhoods having significantly lower access to high quality play spaces (Abercrombie et al., 2008). The inequitable distribution of high quality play
spaces was established more than 20 years ago, but continues to play a role in
exacerbating health inequalities among children that can persist into adulthood
(Geronimus, 2000).
Public health and community design interventions
have prioritized the creation of quality play space, especially in easy to
access, public places, to improve health outcomes and to reduce health
inequities(Brown et al., 2019). Many relevant interventions have evaluated the
influence of school or clinical play-based interventions to improve health
outcomes (Lee et al., 2020). The “Play Everywhere Philly Challenge”, led by
KABOOM!, funded 16 play spaces to support child development and literacy skills
in communities across Philadelphia. The 16 spaces were selected to ensure
access for low-income neighborhoods. Play Everywhere Philly builds on the
evidence presented in the 2019 report “Philadelphia Playful Learning
Landscapes: Scaling Strategies for a Playful Learning Movement” that documented
the use of playful learning landscapes to enhance STEM and literacy in
child-caregiver interactions and build social and mental capital (Robinson, 2019).
Despite existing guidelines and best practices for
the design of these spaces (Moore et al., 2022), the original plan for KABOOM’s evaluation of
interventions did not include an assessment of how key design and contextual
features influence the use of the space. Without these data, it is difficult to
determine which elements of the play space are most important for promoting
play and ultimately improving health outcomes. Recent studies evaluating
process outcomes of similar interventions to create or enhance play spaces have
focused on qualitative research but have not quantified the potential design characteristics
that may influence use and engagement (Dankiw et al., 2020; Elliott et al., 2018;
Miller et al., 2022). To fill this
gap, our team designed a multi-pronged process evaluation to assess the design
and contextual features of the new installations developed as part of the “Play
Everywhere Philly Challenge” and children’s use and engagement with these
spaces. This paper describes the findings from our process evaluation.
Methods
Design
The evaluation protocol was developed by an
interdisciplinary group of public health and urban design researchers and
consisted of a three-pronged methodology. This included: (1) Geospatial mapping
and analysis of neighborhood context; (2) systematic observations of spaces and
people; and (3) intercept surveys of adult, English-speaking visitors. To focus on findings most relevant to children, we do
not include data from the intercept surveys in this analysis and we report
analysis of observational data specific to children only.
Sample
Community groups responded to the Play Everywhere
Philly Challenge call for proposals issued by KABOOM to receive funding for a
play space that would be in a publicly available space within the neighborhood.
KABOOM for made all decisions regarding funding and approved the plan for each
of the play installations. For our process evaluation, we assessed neighborhood
context for all 16 funded installation locations using geospatial mapping in
summer of 2022. Seven play space installations were either incomplete,
unavailable, or the installation had been damaged between installation (summer
2021) and our evaluation, thereby limiting the evaluation team’s ability to
complete the observational protocol for those spaces. Thus, the full protocol
was completed for 9 sites.
Measures
We calculated quarter mile (400-meter) walking
network buffers from each installation site using ArcGIS Pro 2.9 and Python
3.9.7. Data on sociodemographic characteristics (racial composition, age
distribution, housing burden), built environment (bus routes, rapid transit,
bike infrastructure, walkability), and amenities (child amenities, parks,
greenness) were linked to these buffers using areal weighting. Data sources
included US Census American Community Survey 2016-2020 (sociodemographic
characteristics); Delaware Valley Regional Planning Commission 2012, 2021
(rapid transit); Pennsylvania Spatial Data Access 2016 (bus routes, parks,
greenness); OpenDataPhilly 2018, 2022 (bike infrastructure); WalkScore™
(walkability); and National Establishment Time Series 2019 (child amenities). A
technical report describing the details
for data sources and GIS analyses available upon request from first author.
We used two existing systematic observation tools
to collect information on the physical environment of the play spaces and use
of the space. For the physical environment, we modified the Environmental
Assessment of Parks and Recreations Spaces (EAPRS) Measurement Tool (Geremia et al., 2019; Saelens et al., 2006). To align with the urban spaces being observed,
we eliminated elements that are more appropriate for natural environments, such
as hiking trails. For each remaining element, we evaluated the presence
(yes/no), condition, and cleanliness using the criteria from the original EAPRS
tool. EAPRS was performed on all completed sites June 28-July 5, 2022. To
evaluate use of the space, we adapted the System for Observing Play and Leisure
Activity in Youth (SOPLAY) for this study (McKenzie, 2016; McKenzie et al., 2000). Specifically, the team used momentary time
sampling to systematically and periodically scan and count adults and children
in the play space site and engaging with the installation. Specifically, we assessed the number of children and
adults present and the number of children and adults who were engaged with the
installation in any way. The type of engagement varied based on the installation,
but it could be active/physical (climbing) or passive/non-physical (watching,
reading). The original SOPLAY
instrument additionally characterizes intensity and type of activity (e.g.,
jumping, soccer, etc.) for those persons observed during each scan but our
modified instrument did not include that additional data points because they were
not relevant to the goals of our process evaluation. From July-August 2022, two
field observers performed scans on completed installations every 15 minutes
during three shifts: morning (8-11am); afternoon (12-3pm); and evening (4-7pm).
Where possible, this was done across weekdays and weekends to understand time
and weekly patterns. This resulted in 18 hours-worth of observation for most
sites. One site was a pop-up play space that removed all play materials at 5 pm
and another site was closed to the public after 5 pm so we were not able to
conduct full evening observations of these sites.
All data were collected by trained observers using
computer-assisted technology (i.e., iPads). The project hired field observers
who were trained by two main project leads (YLM, JAH) in two 4-hour sessions,
which included training on the protocol, including safety and logistics, and
practice collecting in the field. Modification of the observational tools was
conducted by two project leads (YLM, JAH) and all the project’s instruments are available
by first author upon request.
Analysis
To understand context, we calculated averages of
neighborhood characteristics and described them independently as well as
compared to city-wide averages (where relevant). We created categories of
design characteristics from combinations of EAPRS observed variables based on
key design principles (Kaboom, 2023). These design elements included: (1)
presence of interactive components to climb, jump on, or otherwise move
(active/kinetic), (2) presence of shade, and (3) condition. Presence of
interactive components were evaluated based on the presence of 2 or more of the
following elements: playset or structure; things to hang from (part of playset;
non-playset); things to slide down (part of playset; non-playset); functional
stairs, ladders & ramps; fun things to climb on/up/through; things to stand
or walk on; swings. Shade was assessed based on the percent of the installation
that was shaded during full sun (low: 0-33%, moderate: 34-66%, high: 67-100%). Condition
was determined by the ratings for play space and neighborhood conditions and
cleanliness. For all elements present at the installation, we summed the scores
for condition (rated 1 (poor) to 3 (excellent)) and cleanliness (rated 1 (not
at all) to 3 (mostly/extremely)). The sum was categorized using terciles to
represent “excellent”, “moderate”, and “low”.
SOPLAY counts were summed within each hour of
observation and average visitation (i.e., children/hour) and engagement (i.e.,
percentage of children engaging) were calculated across installation, day of
week, time of day, contextual factors, and design elements.
Results
Context
Installations were in areas with higher average
proportions of non-Hispanic Black (44.5%), Hispanic (17.2%), and Asian (7.5%)
populations than the city as a whole (40.1%, 15.1%, 7.4%, respectively) (Supplemental
Figure S1). An average of 3724 people live within a ¼-mile of an installation,
including 252 children under 5 and 222 children aged 5 to 9. Installations were
often located near other child-related amenities; within ¼-mile of
installations there were an average of 2 child physical activity facilities,
0.4 preschools, 1.5 schools, 3.2 daycares, and 2.0 parks. Most installations
were accessible for those without a vehicle; 81% of sites had at least 4 bus
routes within ¼-mile, 44% had rapid transit within 0.5 km, and 81% are in areas
deemed “Very Walkable” or “Walker’s Paradise” by WalkScore™.
Design
Of the nine complete installations, three had
interactive components to climb, jump on, or otherwise move (“active/kinetic”),
three were primarily reading or presentation of other visual information that
were fixed features requiring the child or caregiver to initiate the activity
(“passive”) and the remaining three were “mixed” but lacked enough kinetic
components to be considered active (see Figure 1). Three sites had greater than
a third coverage of shade and some trees present (“shaded”). Four sites were in
“excellent” condition, two “moderate”, and three “low” representing a
combination of play space and neighborhood conditions and cleanliness.
Figure
1. Examples of Play Spaces Designed as part of the KABOOM! Play Everywhere
Philadelphia Challenge
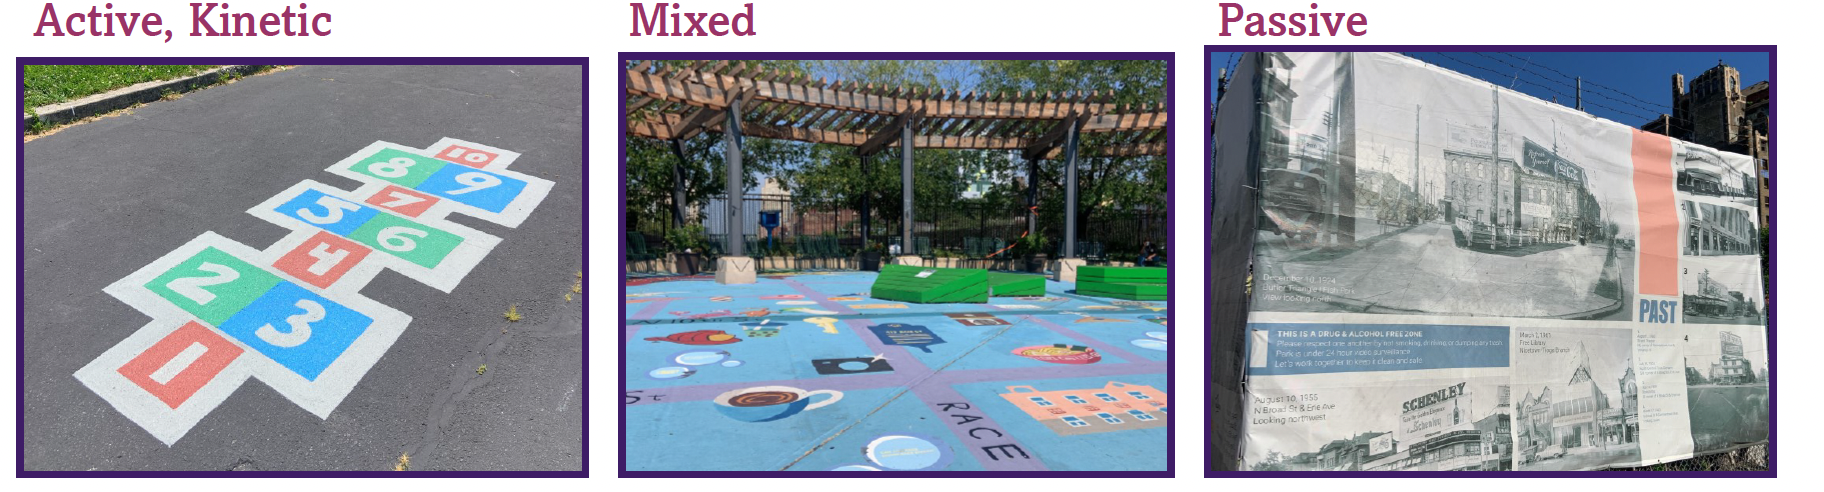
Active, kinetic installations
had interactive components. They may have involved things to climb, jump on, or
otherwise move. Mixed sites had both active and passive features but not enough
kinetic components to fall into the active category. They may have things for
kids to touch, grab, or experiment with. Passive installations were primarily
reading or presentation of other visual information. They were usually fixed
features that require the child or caregiver to initiate the activity.
Use
On average, we observed 2.5 children/hour and 52%
of the children engaged with the installations. The busiest time was weekdays
in the afternoon (12pm-3pm). Engagement was substantially higher in “Very
Walkable” locations (61% children) compared to “Walker’s Paradise” locations
(32% children), potentially reflecting spaces where people pass quickly through
on their way to another errand or activity. The site with the largest
population of children living nearby also had the highest visitation and engagement.
There was no discernible pattern of visitation or engagement by shade. Sites
with low condition had the lowest number of visitors (0.3 children). Active,
kinetic installations had an average of 5.5 children visitors/hour, 62% of whom
engaged with the installation. The team saw that even though visitation dropped
for mixed sites (1.2 children/hr.), engagement remained higher (48%). Passive
sites had low visitation (1.3 children/hr.) and engagement (19%) (Supplemental Figure
S2).
Discussion
Summary
In this study, our interdisciplinary group of
public health and design professionals developed and implemented an integrated
set of tools to comprehensively assess specific design and contextual features
of urban play spaces. We identified aspects of installations associated with
greater use of the spaces. Our multi-pronged approach can serve as a model to
improve evaluations of play-based interventions by identifying specific
elements linked to play that reduce inequities in the social, physical, and
cognitive health of children.
Prior research has primarily focused on
identifying individual-level or intra-individual factors associated with use of
new or modified play space. For example, recent research on the factors that
influence children’s use and engagement with play spaces identified
individual-level factors, including adults who support use, limited time for
play, and distance to the closest play space, or policy-level factors including
funding and scheduling. In contrast, we have focused on using quantifiable
observational data to identify contextual- and design-level factors that
influence use and engagement (Dankiw et al., 2020; Elliott et al., 2018;
Miller et al., 2022).
Limitations
While we implemented all possible tools at each
installation, our observations were limited to a subset of sites due to access
hours or play space improvement completion. Nonetheless, our methods provided
meaningful information across a range of contexts including type of improvement
(kinetic/passive) and installation location (indoor/outdoor). The evaluation was
limited to post-installation and covered a short time period (two months) which
occurred a year after installation. Thus, we are unable to evaluate change in
use and our data may not represent conditions or visitation at the play spaces
in other seasons or at other points in time (e.g., immediately after or a few
years post improvement). We ensured observations covered days of week (i.e.,
weekday, weekend) and times of day (i.e., morning, afternoon, evening), but
they still represent only a snapshot of activity and engagement. For example,
some play spaces may have events or staffing to increase visitation or
engagement at other times. Additionally, due to installation-specific
schedules, total hours observed varied between installations where observations
took place. While we adjusted for site-specific hours when calculating
visitation and engagement, this may have introduced measurement error into our
results. GIS data came from numerous administrative sources, which have
temporal lags that may result in a mismatch between dates of observations and
contextual factors. However, we would expect any misclassification error this
introduces to be uniform across play spaces. Finally, we did not collect
individual-level data from children thus we cannot provide any insight on
individual characteristics that influence use or engagement with the play
spaces.
Significance
This evaluation helped to clarify design aspects
of spaces and neighborhoods that facilitate greater use and engagement of play
space improvements. Several recommendations emerge from our findings and
provide quantitative evidence to support the KABOOM! Playbook Fundamentals (Kaboom, 2023). First, the location of installations is important;
sites should be in areas of deep need, with larger child populations, and easy
access without a car. Second, our data supports development of spaces that
include active play opportunities.
Correspondence should be addressed to
Yvonne L. Michael
Nesbitt Hall, 5th Floor, 3215 Market
Street, Philadelphia, PA 19104
ylm23@drexel.edu
267-359-6064
 Yvonne
L. Michael: 0000-0002-1494-8498
Yvonne
L. Michael: 0000-0002-1494-8498
Stephen
T. Dickinson: 0000-0001-6113-6452
Jana
A. Hirsch: 0000-0003-3355-5558
Acknowledgements
The opinions expressed in this report are those of the
author(s) and do not necessarily reflect the views of the WPF or UHC. All GIS
data were collected and maintained by the UHC including Steven Melly and
Stephen Francisco. The author team would like to acknowledge the hard work of
the Drexel field team: Channa Buxbaum, Natalia Brownstein, Dustin Fry, Julia
Langmuir, Vishwa Patel, Sarah Weinbrom, Douglas Whitmire, and Vanessa Xie.
Conflicts of Interest
The authors state that there are no conflicts of
interest associated with this work.
Contributions
Conceptualization, Y.L.M and J.A.H.; Methodology,
Y.L.M, D.N., D.R., N.E, J.A.H.; Investigation, Y.L.M, D.N., D.R., S.T.D.,
J.A.H.; Writing – Original Draft, Y.L.M, J.A.H., Writing – Review &
Editing, D.N., D.R., N.E, S.T.D. Funding Acquisition, J.A.H.
Creative Commons License:
This work is licensed under a Creative Commons Attribution-Noncommercial 4.0
International License (CC BY-NC 4.0).
Funding
This evaluation was funded by the William Penn
Foundation (WPF) with supplemental assistance from the Urban Health
Collaborative (UHC), Dornsife School of Public Health, Drexel University.
References
Abercrombie,
L. C., Sallis, J. F., Conway, T. L., Frank, L. D., Saelens, B. E., &
Chapman, J. E. (2008). Income and Racial Disparities in Access to Public Parks
and Private Recreation Facilities. American Journal of Preventive Medicine,
34(1), 9-15. https://doi.org/https://doi.org/10.1016/j.amepre.2007.09.030
Brown,
A., Ma, G., Miranda, J., Eng, E., Castille, D., Brockie, T., Jones, P.,
Airhihenbuwa, C., Farhat, T., Zhu, L., & Trinh-Shevrin, C. (2019).
Structural Interventions to Reduce and Eliminate Health Disparities. American
journal of public health, 109(S1), S72-S78. https://doi.org/10.2105/AJPH.2018.304844
Dankiw,
K. A., Tsiros, M. D., Baldock, K. L., & Kumar, S. (2020). The impacts of
unstructured nature play on health in early childhood development: A systematic
review. Plos one, 15(2), e0229006.
Elliott,
S., Rizk, N., Taylor, S., Kennelly, J., & McKenzie, M. (2018). ‘When are we
going again?’Investigating children’s responses to a new nature playspace at an
environmental education centre. Curriculum Perspectives, 38,
157-162.
Geremia,
C. M., Cain, K. L., Conway, T. L., Sallis, J. F., & Saelens, B. E. (2019).
Validating and shortening the environmental assessment of public recreation
spaces observational measure. Journal of physical activity and health,
16(1), 68-75.
Geronimus,
A. T. (2000). To mitigate, resist, or undo: addressing structural influences on
the health of urban populations. American journal of public health,
90(6), 867.
Hartig,
T., Mitchell, R., De Vries, S., & Frumkin, H. (2014). Nature and health. Annual
review of public health, 35, 207-228.
Kaboom.
(2023). Play Everywhere Playbook Fundamentals. Retrieved March 9, 2023
from https://kaboom.org/playbook/fundamentals
Krishnamurthy,
S. (2019). Reclaiming spaces: child inclusive urban design. Cities &
Health, 3(1-2), 86-98. https://doi.org/10.1080/23748834.2019.1586327
Lee,
R., Lane, S., Brown, G., Leung, C., Kwok, S., & Chan, S. (2020). Systematic
review of the impact of unstructured play interventions to improve young
children's physical, social, and emotional wellbeing. Nursing & Health
Sciences, 22(2), 184-196.
Lillard,
A. S., Lerner, M. D., Hopkins, E. J., Dore, R. A., Smith, E. D., &
Palmquist, C. M. (2013). The impact of pretend play on children's development:
a review of the evidence. Psychological bulletin, 139(1), 1.
McKenzie,
T. L. (2016). Context matters: Systematic observation of place-based physical
activity. Research quarterly for exercise and sport, 87(4),
334-341.
McKenzie,
T. L., Marshall, S. J., Sallis, J. F., & Conway, T. L. (2000). Leisure-time
physical activity in school environments: an observational study using SOPLAY. Preventive
medicine, 30(1), 70-77.
Miller,
N., Kumar, S., Pearce, K., & Baldock, K. (2022). Primary school educators’
perspectives and experiences of nature-based play and learning and its
benefits, barriers, and enablers: A qualitative descriptive study. . International
Journal of Environmental Research and Public Health, 19(6).
Moore,
A., Boyle, B., & Lynch, H. (2022). Designing public playgrounds for
inclusion: a scoping review of grey literature guidelines for Universal Design.
Children's Geographies, 1-17.
Nijhof,
S. L., Vinkers, C. H., van Geelen, S. M., Duijff, S. N., Achterberg, E. J. M.,
van der Net, J., Veltkamp, R. C., Grootenhuis, M. A., van de Putte, E. M.,
Hillegers, M. H. J., van der Brug, A. W., Wierenga, C. J., Benders, M. J. N.
L., Engels, R. C. M. E., van der Ent, C. K., Vanderschuren, L. J. M. J., &
Lesscher, H. M. B. (2018). Healthy play, better coping: The importance of play
for the development of children in health and disease. Neuroscience &
Biobehavioral Reviews, 95, 421-429. https://doi.org/https://doi.org/10.1016/j.neubiorev.2018.09.024
Robinson,
J. P. (2019). Philadelphia Playful Learning Landscapes: Scaling Strategies
for a Playful Learning Movement. http://www.brookings.edu/about/centers/universal-education
Saelens,
B. E., Frank, L. D., Auffrey, C., Whitaker, R. C., Burdette, H. L., &
Colabianchi, N. (2006). Measuring physical environments of parks and
playgrounds: EAPRS instrument development and inter-rater reliability. Journal
of physical activity and health, 3(s1), S190-S207.
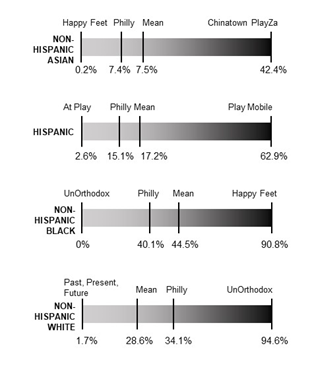
Supplemental Figure S1:
Demographic Characteristics of the Neighborhoods Surrounding KABOOM! Play
Everywhere Installations in Philadelphia, PA (summer 2022)
Data collected within 1/4
mile of installations found a higher mean for installations of percentage of
Hispanic, Non-Hispanic Asian, and Non-Hispanic Black residents and a lower mean
percentage of Non-Hispanic White residents compared to city demographics. On
average, the Non-Hispanic Black population represented the largest
racial/ethnic group in the surrounding area (47.5%), while the Non-Hispanic
Asian population represented the smallest proportion (8.0%). The mean
proportion of children living near installations is roughly reflective of the
broader city-wide age distribution. However, this varies across sites; central
sites tend have smaller local child populations, while northern sites have
comparatively more children.
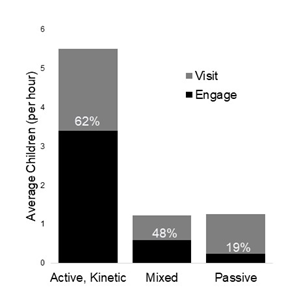
Supplemental Figure S2:
Child Visitation and Engagement by Design Type to KABOOM! Play Everywhere
Installations in Philadelphia, PA (summer 2022)
Active, kinetic installations
had an average of 5.5 children visitors per hour, 62% of whom engaged with the
installation. The team saw that even though visitation dropped for mixed sites
(1.2 children/hr.), engagement remained higher (48%). Passive sites had low
visitation (1.3 children/hr.) and engagement (19%). Visitation patterns were
not as clear for adults (not shown), although engagement was 29% for adults in
active sites and only 11% in passive sites.